
What is Key Driver Analysis?
Key driver analysis (KDA) is a technique used in market research to identify the key drivers that influence a specific outcome or behavior. It does this by evaluating a group of drivers- like quality, product design, customer experience, or price- and weighs their relative importance in predicting an outcome. For example, let’s say you just received data from a customer satisfaction (CSAT) survey, but the numbers weren’t quite what you’d hoped for. While you recognize that you’ll need to change something to improve your CSAT score, you’re not quite sure which factors influenced this downturn in the first place. Using this technique you can survey respondents to evaluate all of the potential factors involved to understand which are the most important to your customers and how they would rate your performance on each. From the data, you can quickly see which areas are most impactful for your target market, where you’re already succeeding, and what you can do to improve. But key driver analysis doesn’t just help with customer satisfaction, it can also help you answer questions like:- What can we do to grow brand loyalty?
- How can we increase purchase intent for a specific market segment?
- Should we focus on reducing prices or enhancing the quality of our products to improve sales?
What are Drivers?
Before we get too deep into the “analysis” portion of a key driver analysis, let’s examine the drivers themselves. Drivers are the factors that can potentially impact your organization’s performance. And the factors that have the most meaningful impact on performance are known as key drivers. Your specific drivers (and key drivers) will be entirely dependent on your category and use case. For example, if you’re trying to better understand your customer satisfaction score (CSAT), then the drivers you might want to investigate would be pricing, customer service, quality, or customer experience. However, if you’re evaluating your new website, you may want to look at drivers like overall design, user experience, or speed.How to Use Key Driver Analysis
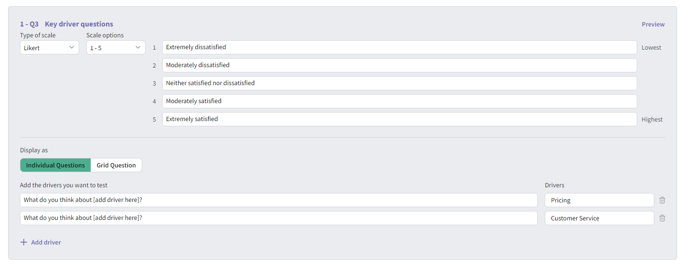
With SightX, assessing your key drivers has never been simpler. After selecting “Key Driver Analysis” from the add-item menu, the experiment will immediately populate, giving you the space to add a description of your product.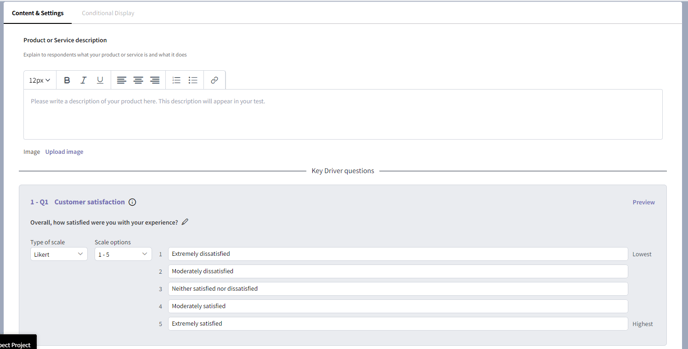
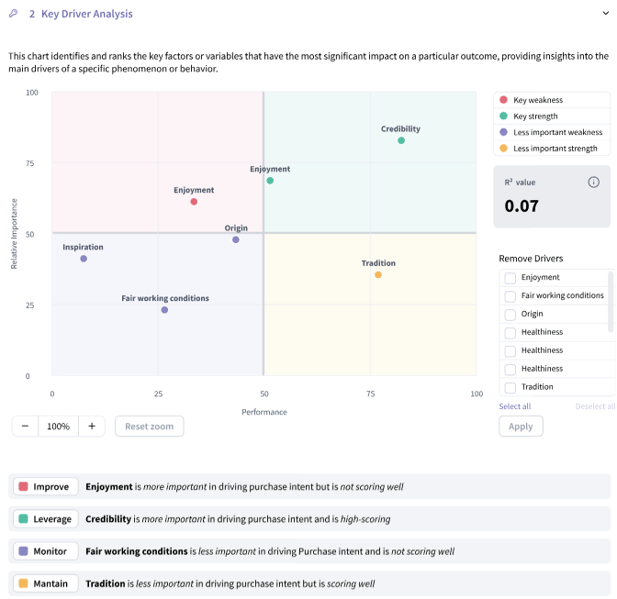
- Drivers in the Green Quadrant have high performance scores and a high level of importance to customers. You will definitely want to take note of the drivers in this quadrant as you can leverage your success in these areas to keep customers satisfied with a relatively low lift.
- Drivers in the Red Quadrant have low performance scores but carry a high level of importance for customers. This quadrant highlights which elements of your business you should improve to drive the greatest impact.
- Drivers in the Purple Quadrant have low performance scores and low importance scores. While you shouldn’t ignore them entirely, you can likely leave these on the back burner without much of an impact on your business.
- Drivers in the Yellow Quadrant have high performance scores but are of low importance to consumers. While it is good to understand all of the areas you are succeeding in, these drivers don’t necessarily need your focus.