Align Your Research Reports with Your Brand
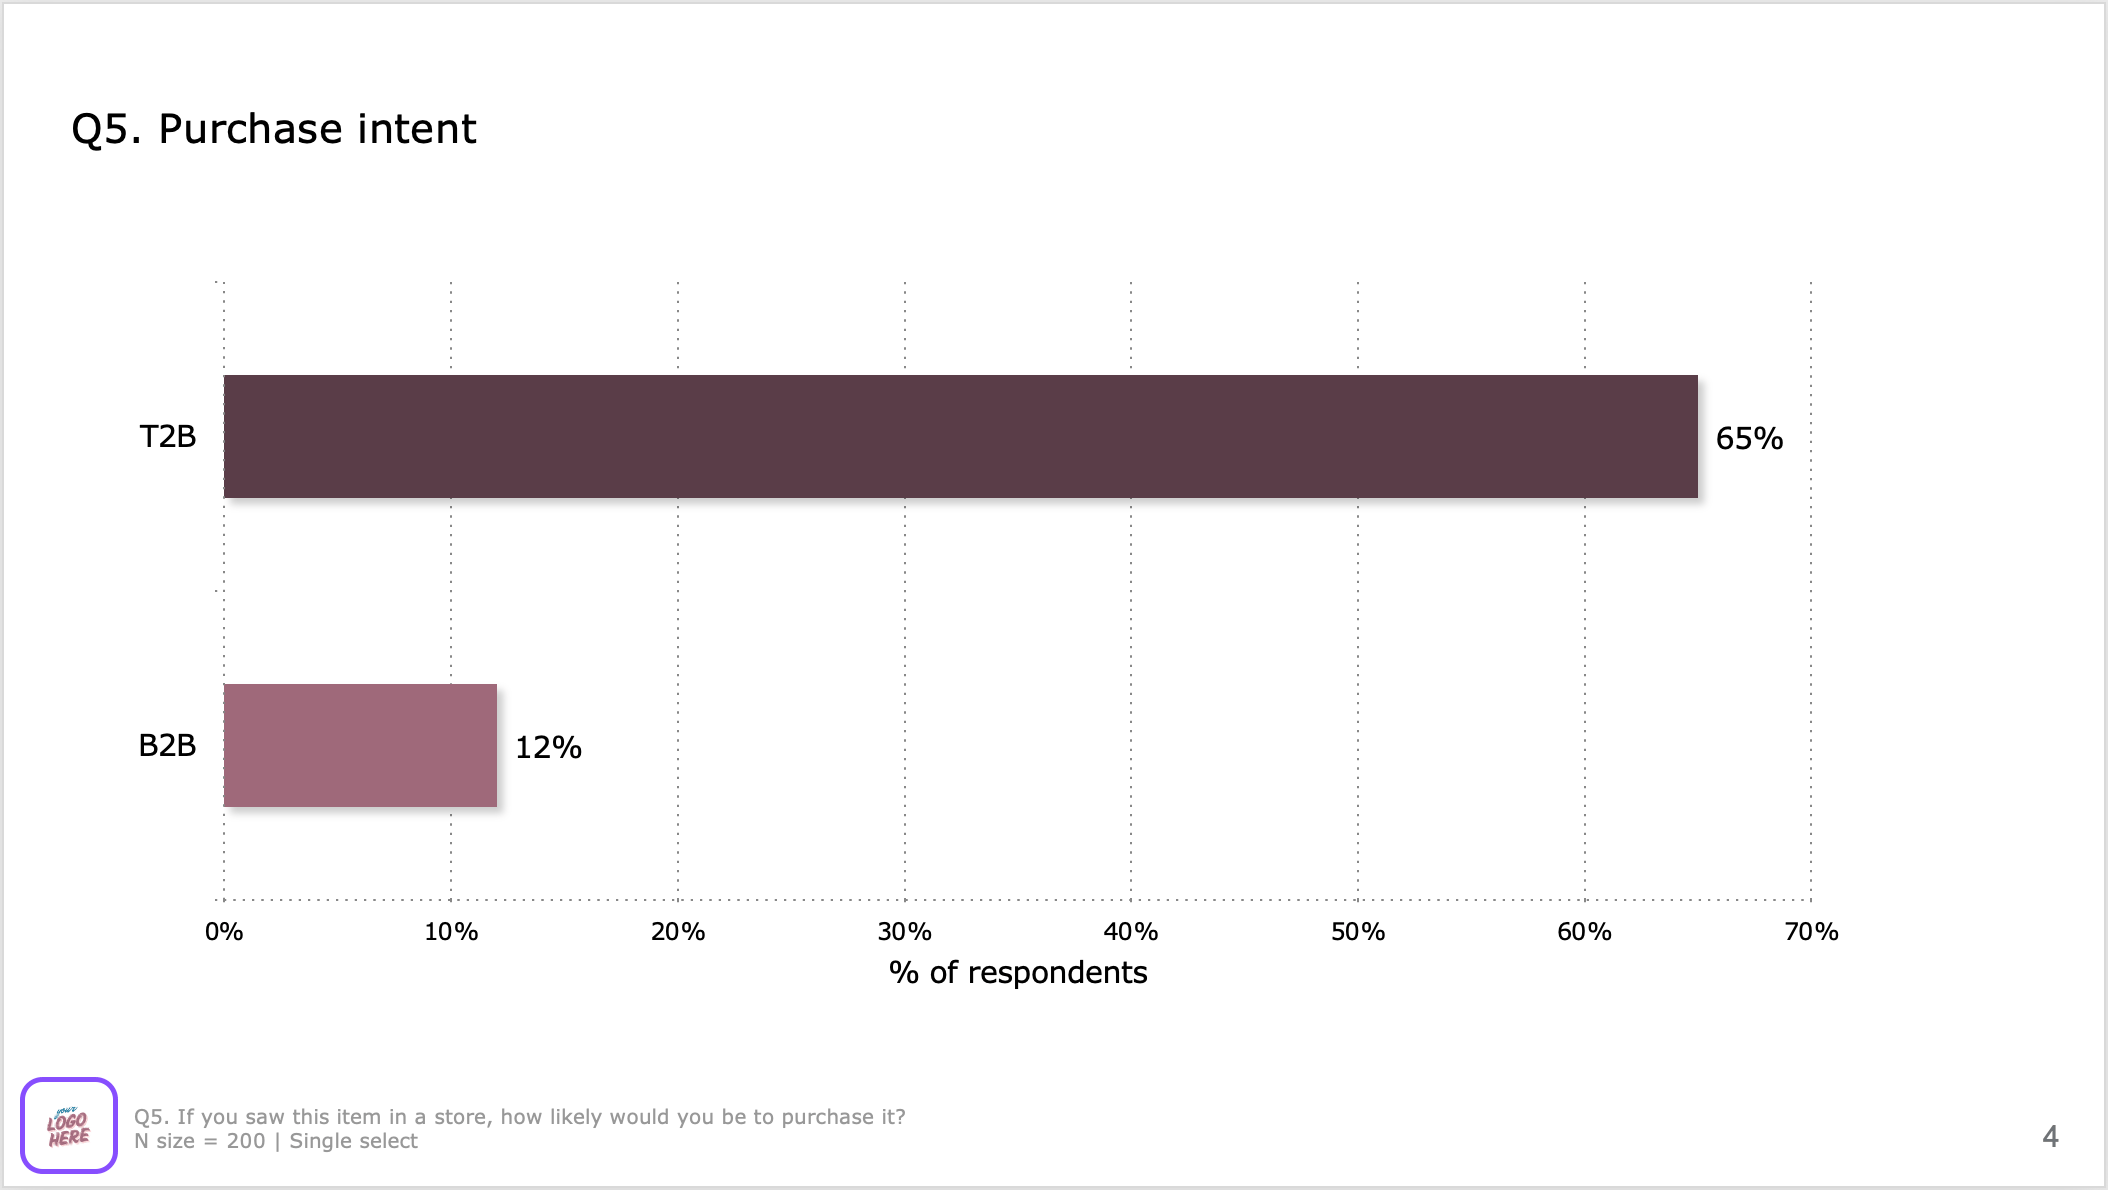
The Branding module allows you to set brand style settings for your team’s SightX account, which will be reflected in SightX analysis dashboards and Powerpoint exports.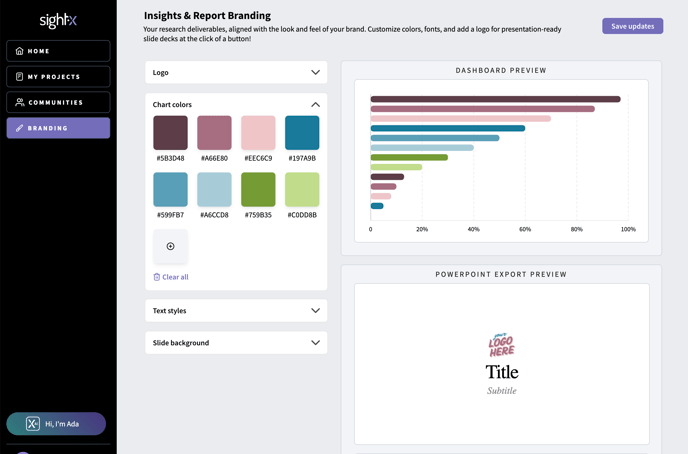
 4. Set the slide background color for Powerpoint exports.
Note that the brand configurations are saved at the account level, so that all users in your SightX account share these settings. Users who are account admins can manage the branding settings for their account.
4. Set the slide background color for Powerpoint exports.
Note that the brand configurations are saved at the account level, so that all users in your SightX account share these settings. Users who are account admins can manage the branding settings for their account.
Tailor Data Visualizations for Clear, Concise Reports
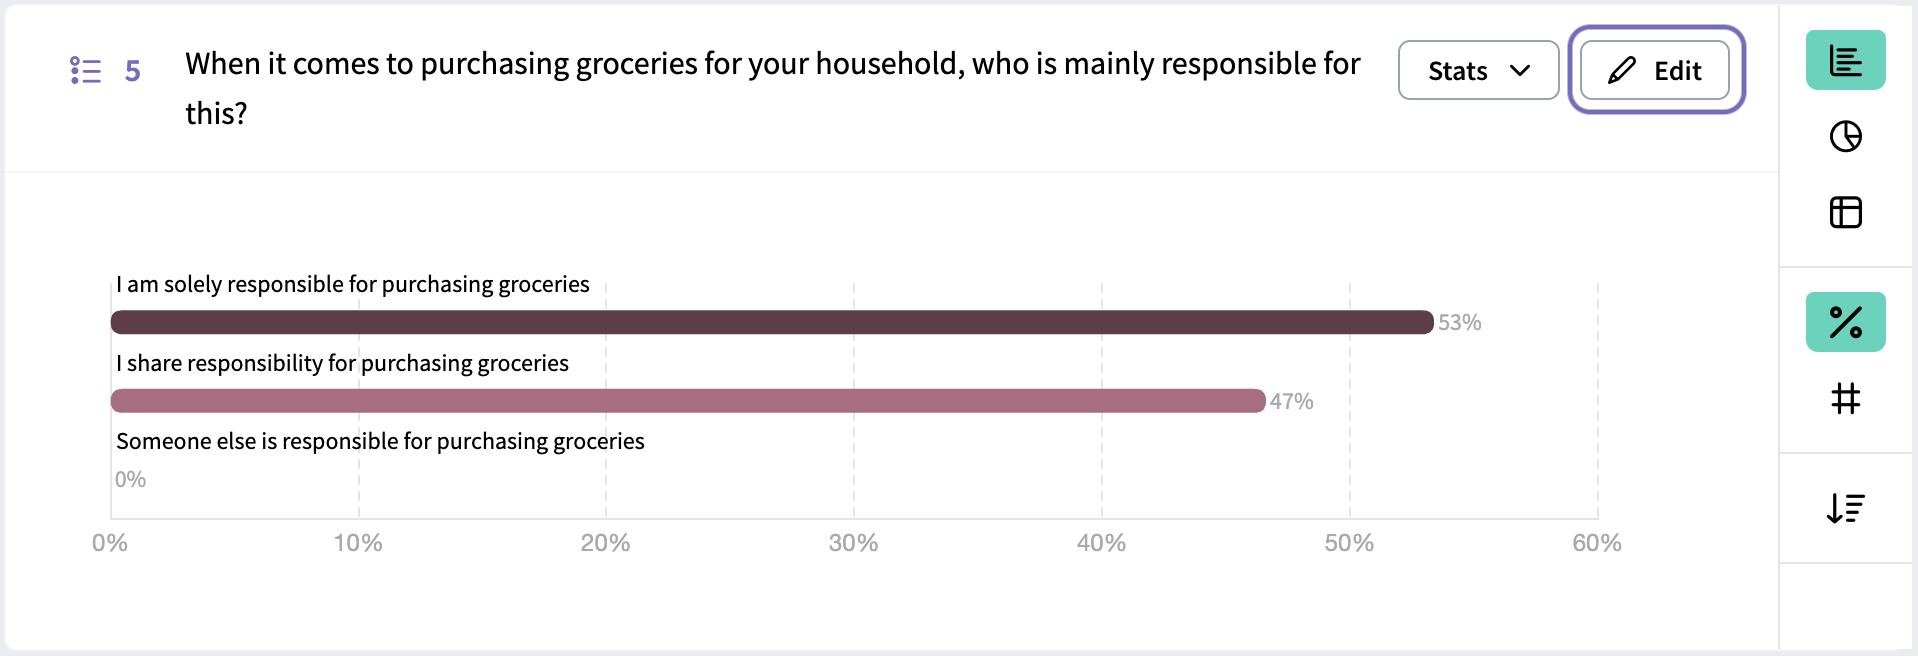
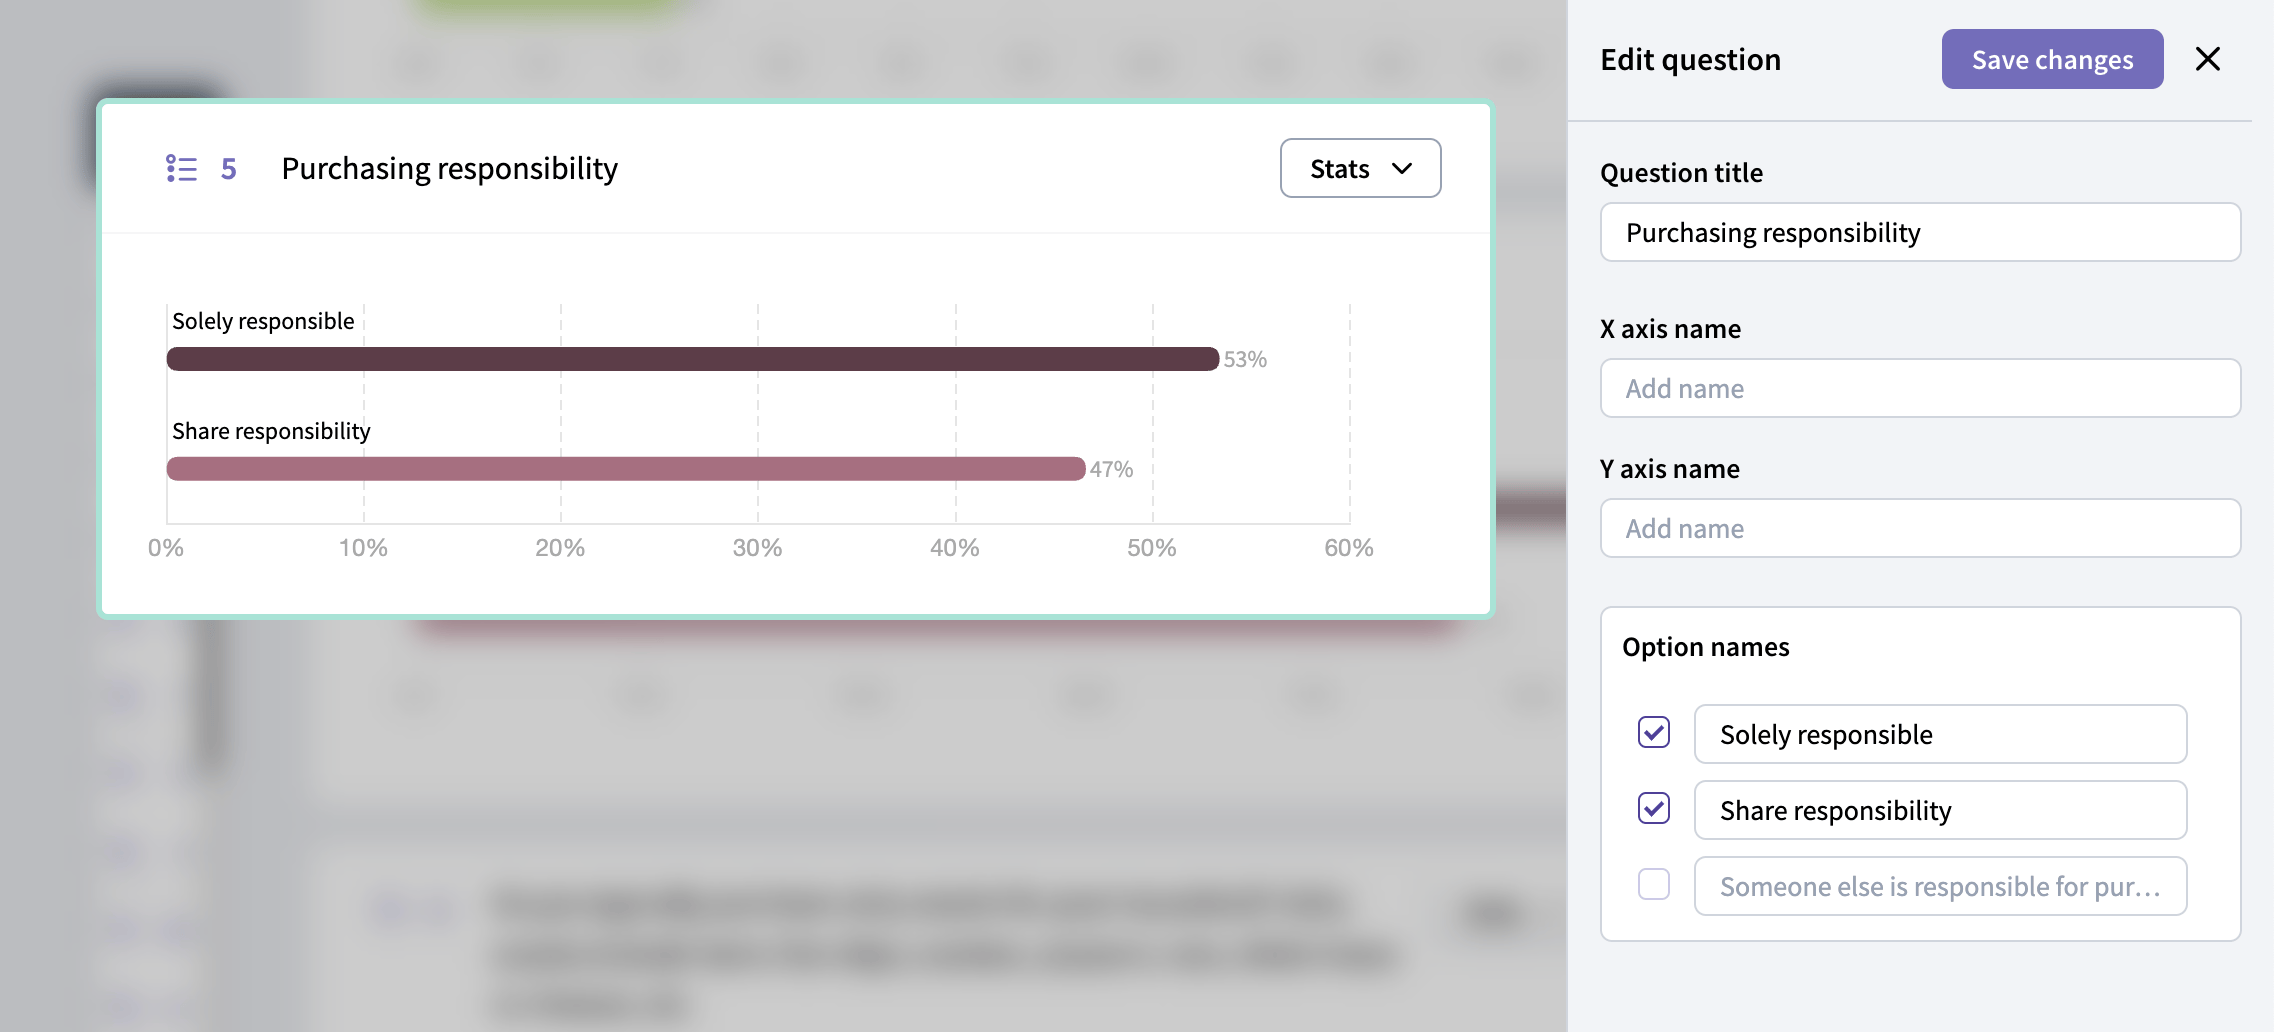
Advanced chart edit settings allow you to re-label survey questions, answer options, and axes to add clarity and remove unneeded text from graphs. You can also hide irrelevant answer options and data series from graphs to focus attention on key insights. To get started, click the “Edit” button on any chart on the Question Analysis dashboard.