What is Segmentation?
In today’s competitive landscape, understanding your customer is everything. But true understanding goes deeper than basic demographics; it’s about discovering the hidden patterns in their behavior. Segmentation, or clustering, is the key that unlocks this insight. Clustering is a fundamental data analysis technique that moves beyond assumptions by identifying natural groupings within your datasets. Essentially, it helps answer critical questions like:- Which customers behave similarly?
- Which product features are most used together?
- What are our real market segments?
Creating Segments
Once you’ve finished collecting responses and cleaning your data, navigate to the Analysis section of your project and choose the “Segmentation” tab.Step 1: Define Your Population
The first step in any strong analysis is focus. Before you can find segments, you need to define the overall group of people you want to analyze. For instance, you might want to find segments only within your female audience, or just among respondents in Europe. In Step 1 of our tool you can choose between:- Select entire population : Choose this if you want to analyze everyone in your dataset without any filters.
- Define subset : Choose this to focus your analysis on a specific group using filters.
 **
If you choose to “Define subset,” you can build a precise audience using your survey questions as filters. You can combine multiple rules using “AND” and “OR” logic to be as broad or as specific as you need.
For example, let’s say you want to find respondents who meet one of two conditions: they are either middle-aged men OR have a mid-range household income.
Your filter would look like this:
**
**
If you choose to “Define subset,” you can build a precise audience using your survey questions as filters. You can combine multiple rules using “AND” and “OR” logic to be as broad or as specific as you need.
For example, let’s say you want to find respondents who meet one of two conditions: they are either middle-aged men OR have a mid-range household income.
Your filter would look like this:
**
 **
This setup would select respondents who are:
Male AND between the ages of 18-44
OR
Have a Family-oriented lifestyle
After setting your filters, click “Apply filters” to confirm your setup. You will see the updated number of respondents on the right, allowing you to verify the size of your target audience:
**
**
This setup would select respondents who are:
Male AND between the ages of 18-44
OR
Have a Family-oriented lifestyle
After setting your filters, click “Apply filters” to confirm your setup. You will see the updated number of respondents on the right, allowing you to verify the size of your target audience:
**
 **
With your audience defined, click “Next” to move on to selecting your variables.
**
With your audience defined, click “Next” to move on to selecting your variables.
Step 2: Define Segmentation Variables
This is the most critical step of your analysis. Here, you’ll choose the survey questions (variables) that the tool will use to find patterns and create your segments. The variables you select will directly shape the final groups you discover. To add a variable click on the “Add variable” button and select the desired question using the dropdown menu.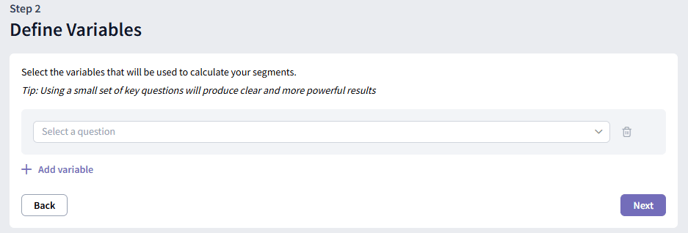
**
 **
You can optionally give your variable a custom name using the**“Variable name”** input field.
Understanding the Types of Variables
Our tool organizes your questions into two main types: Categorical and Numerical.
Numerical variables: These are variables that use numbers for measurement. Think of them as data you can do math with.
**
You can optionally give your variable a custom name using the**“Variable name”** input field.
Understanding the Types of Variables
Our tool organizes your questions into two main types: Categorical and Numerical.
Numerical variables: These are variables that use numbers for measurement. Think of them as data you can do math with.
- Examples: Age, star ratings (1-5), or Net Promoter Score (NPS).
- Question types that will be automatically assigned as numerical:
- Scale questions
- Numeric input questions
- NPS questions
- Multiple choice questions where the answer options are numbers (e.g. 1, 2, 3, 4, 5)
- Grid questions where the columns are numbers (e.g. 1, 2, 3, 4, 5)
- Examples: Brand choices (‘Brand A’, ‘Brand B’), ‘Yes/No’ answers, or demographic groups like ‘Country’.
-
Question types that will be automatically assigned as categorical:
- Multiple choice (single select) questions
-
- Multiple choice (multiple select) questions
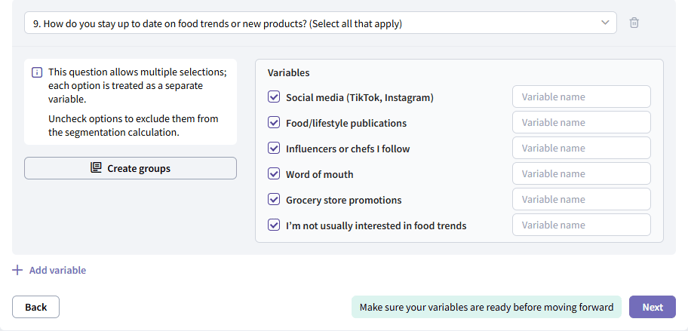
- When respondents can select more than one option, each option becomes a separate categorical variable. For each option, the values of these variables are “selected” or “not selected.”
-
- Grid questions: each row in the grid is treated as a separate variable
- Embedded variables
- This will create 4 total variables for your analysis:
- Concept 1 - Multiple Choice
- Concept 1 - Scale Question
- Concept 2 - Multiple Choice
- Concept 2 - Scale Question
Grouping and Encoding Variable Options
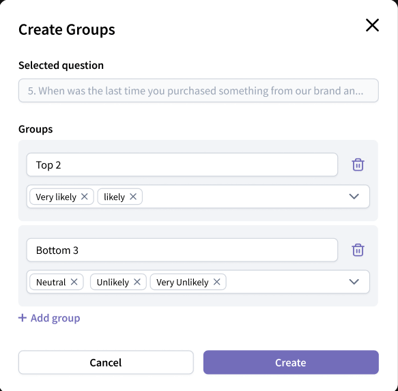
For each question you select, you can combine multiple response options into new groups (Grouping), or assign numeric values to response options (Encoding). Grouping Grouping is useful when you want to simplify your analysis, especially if your survey responses are spread thinly across many options. For example, with a scale like “Extremely Disagree” to “Extremely Agree,” you might group responses into broader categories such as “Top 2” and “Bottom 3” to focus on overall trends and ensure each group has enough data. How to group options:- Add a variable and click **“Create groups.”
 ****
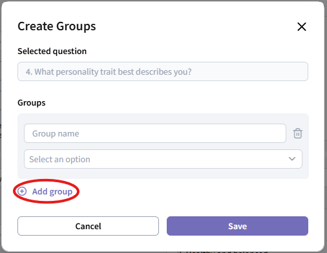
****** 2. In the modal, click “Add group” to create a new group.
- For categorical variables:
- Use the dropdown to assign options to each group.
- You can group as many or as few options as you need, unassigned options will remain as they are.
- Example: Create a “Top 2” group for the top two choices and a “Bottom 3” group for the bottom three choices.
- Each group will be defined by a range of values.
- When you group numeric variables, they become categorical, but you can encode them again to turn them back into numerical values.
- Example: Define age groups like “18-44” and “45-79”
- When finished, click “Create” to save your grouping.
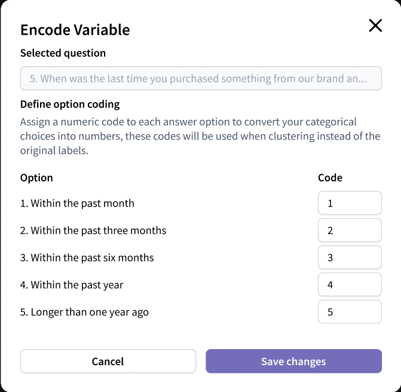
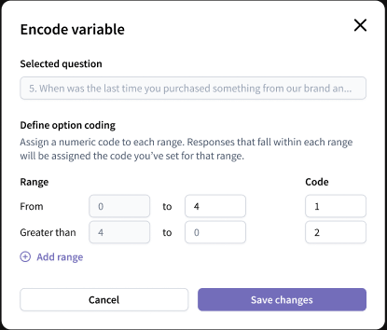
- Add a variable and click “Encode values.”
- Set up encoding
- For categorical questions, scale questions, or variables that you’ve grouped, assign a value to each option in the code column.
Step 3: Handle Missing Values
To perform clustering, all responses need to be complete. On our platform, missing data can occur if a respondent selects “N/A” or if a question is skipped due to survey logic or conditional display. At this step, we check for any missing values in your data and ask you to choose how to handle them.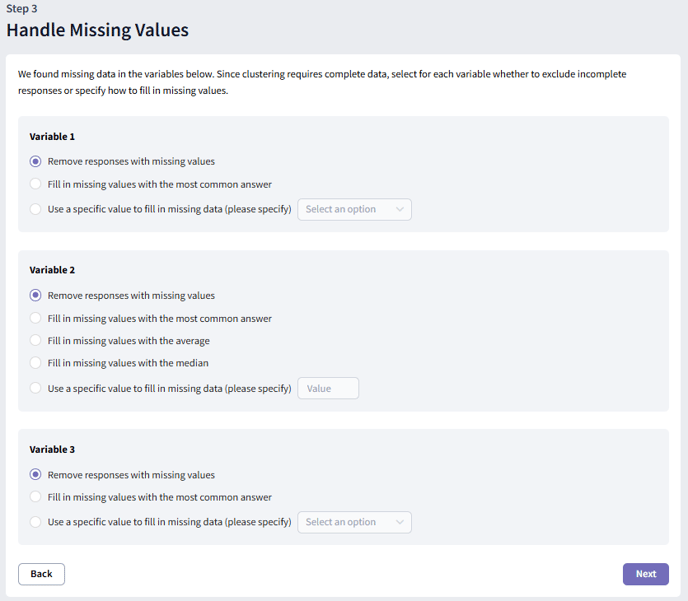
- Fill with the most common answer: All missing values are replaced with the option chosen most frequently in that variable.
- Fill with a specific value: Select a response option from the question to fill in all missing values.
- Fill with the most common answer: Missing values are replaced with the most frequently given response.
- Fill with the average: The mean of the existing responses is used to replace missing values.
- Fill with the median: The middle value (when responses are ordered) replaces missing values.
- Fill with a specific value: Enter a specific number to be used for all missing values.****
Step 4: Exclude Non-informative Variables
At this step, we analyze the variability and correlation of your variables. Variables with low variability or those that are highly correlated with others contribute little new information to your clustering analysis. Removing these variables can improve the quality and interpretability of your results. The tool identifies variables with low variability and groups of highly correlated variables. We recommend keeping only one variable from each correlated group. Select any variables you wish to exclude and click “Next” to go to the next step.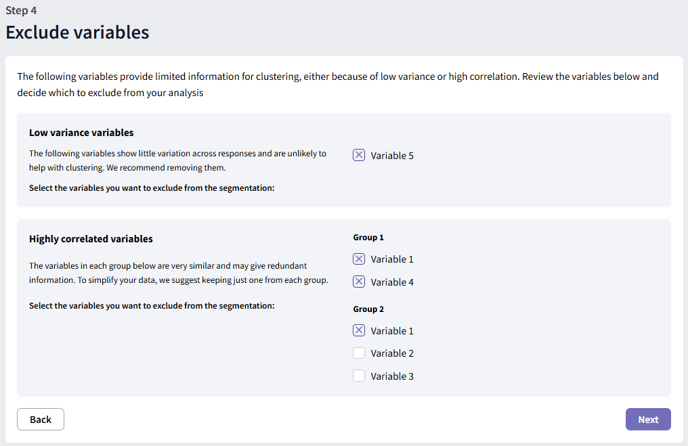
[

 and [
and [
 are the first and third quartiles. Variables with [
 are considered to have low variability and may be excluded.
Categorical variables: If more than 90% of responses fall into a single category, the variable is considered to have low variability and may be excluded.
Deep Dive: Correlation Analysis
Variables that are highly correlated with each other often provide redundant information, which can bias clustering and make results harder to interpret. We recommend keeping only one variable from each group of highly correlated variables. Here’s how we measure correlation:
Between Numerical variables:**
are considered to have low variability and may be excluded.
Categorical variables: If more than 90% of responses fall into a single category, the variable is considered to have low variability and may be excluded.
Deep Dive: Correlation Analysis
Variables that are highly correlated with each other often provide redundant information, which can bias clustering and make results harder to interpret. We recommend keeping only one variable from each group of highly correlated variables. Here’s how we measure correlation:
Between Numerical variables:****We use the squared Pearson correlation coefficient ([
 ). If [
 , variables are regarded as highly correlated.
Between Categorical variables:**
, variables are regarded as highly correlated.
Between Categorical variables:****We use Cramer’s V. If[
 , variables are considered highly correlated.
Between Categorical and Numerical variables:**
, variables are considered highly correlated.
Between Categorical and Numerical variables:****We use the effect size[
 . If [
 , variables are considered highly correlated.
Carefully review the suggested variables and decide which ones to keep or remove. Excluding redundant or low-variability variables helps ensure your clustering is based on informative, distinct inputs, leading to clearer and more actionable results.
, variables are considered highly correlated.
Carefully review the suggested variables and decide which ones to keep or remove. Excluding redundant or low-variability variables helps ensure your clustering is based on informative, distinct inputs, leading to clearer and more actionable results.
Step 5: Variable Scaling
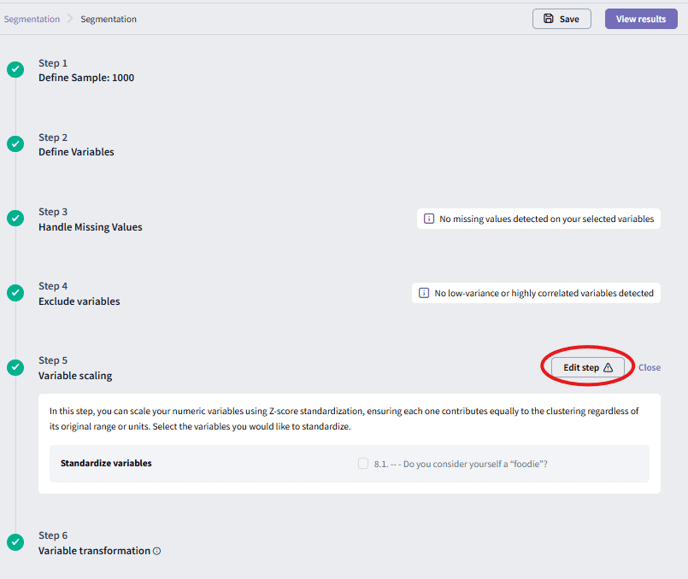
In this step, you can choose which numeric variables to standardize. Standardization is an important preprocessing step for cluster analysis, it ensures all numerical variables are on a similar scale, regardless of their original units or ranges. For example, survey questions might use different scoring ranges (e.g., 1–5 vs. 0–100); standardization prevents variables with wider ranges from dominating the clustering results. Our tool uses Z-score standardization: each value is transformed by subtracting the mean and dividing by the standard deviation, resulting in variables with a mean of 0 and a standard deviation of 1. Select the variables you want to standardize and click “Next” to continue. We recommend standardizing all numerical variables for best results.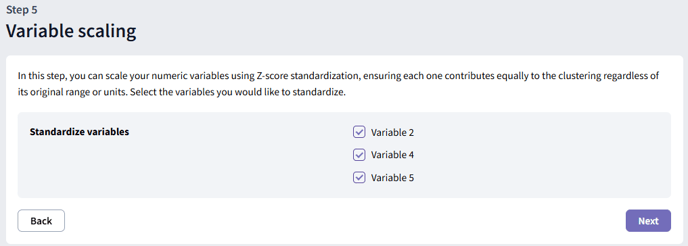
Step 6: Variable Transformation
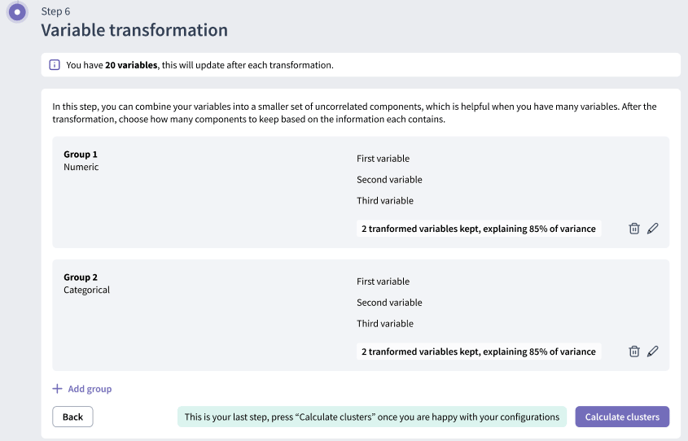
This final step of data preparation uses factor analysis to transform your selected variables into a smaller set of uncorrelated components, helping to reduce redundancy and focus on the most important information. How it works:- For numeric variables, the tool applies Principal Component Analysis (PCA).
- For categorical variables, it uses Multiple Correspondence Analysis (MCA).
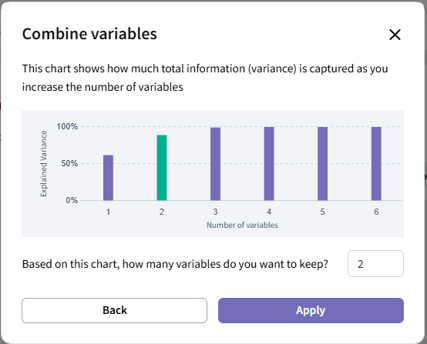
- The resulting components are ordered by how much variation (information) they explain. You can then select the number of components to retain, typically those that explain most of the variation in your data. This is especially helpful if you have many variables and want to simplify your analysis.****
- Click “Add group” to create a new set of variables to combine.
 **
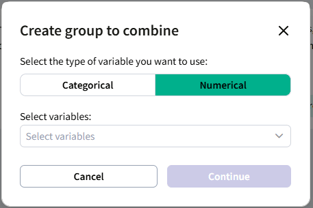
**** 2. In the modal, select the variable type (Categorical or Numeric) and choose the variables you wish to combine.\
Exploring Your Segmentation Results
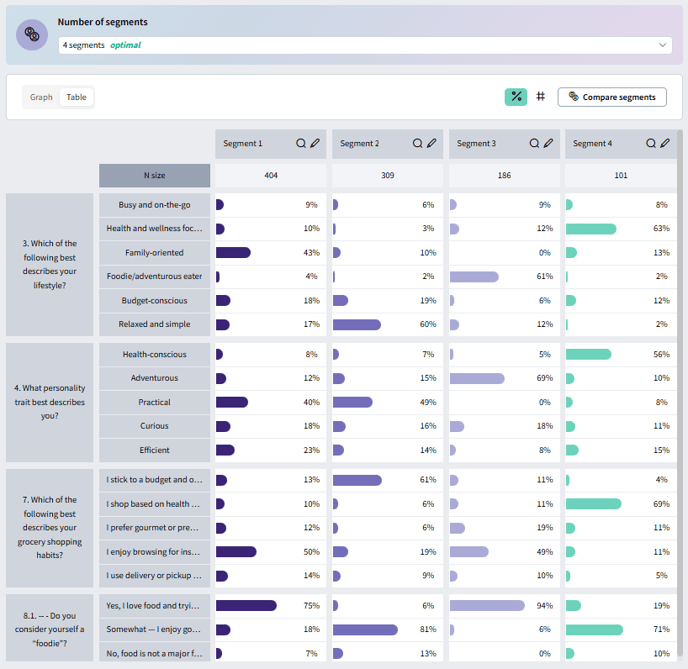
After running your clustering analysis, you’ll land on the results page, where you can review and explore your new segments. Which clustering algorithm was used?- Numeric variables only: The tool uses k-means.
- Categorical variables only: The tool uses k-modes.
- Mixed variables: The tool uses k-prototypes.
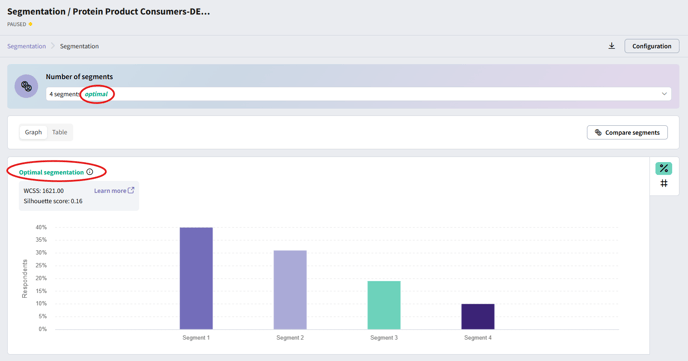
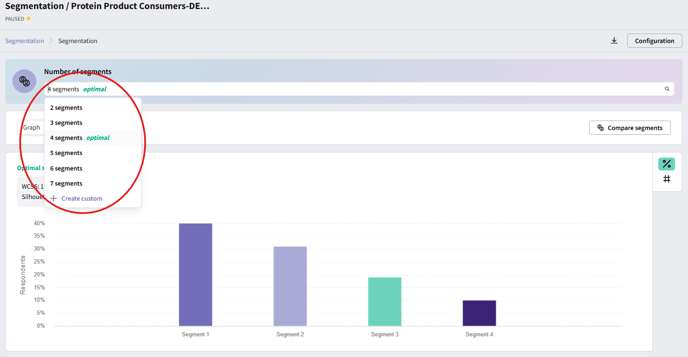
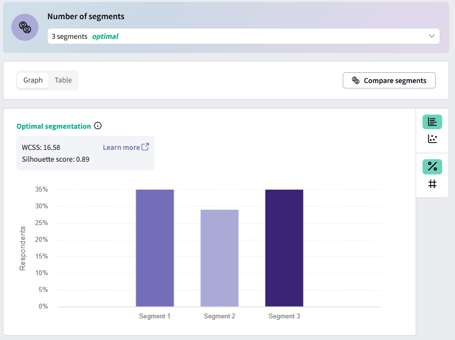
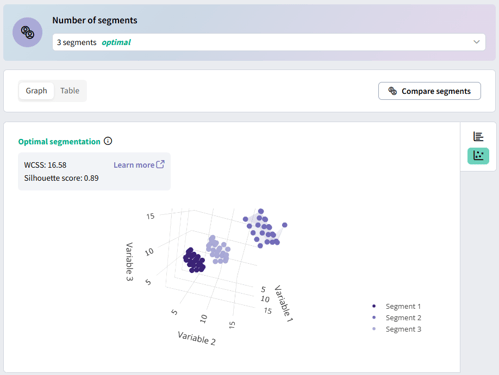
You don’t need to specify the number of segments; the tool determines the optimal number using the elbow method (for within-cluster sum of squares) and the silhouette score.
-
- Rename segments using the pen icon next to each segment name.
- View responses filtered by segment with the magnifying glass icon.
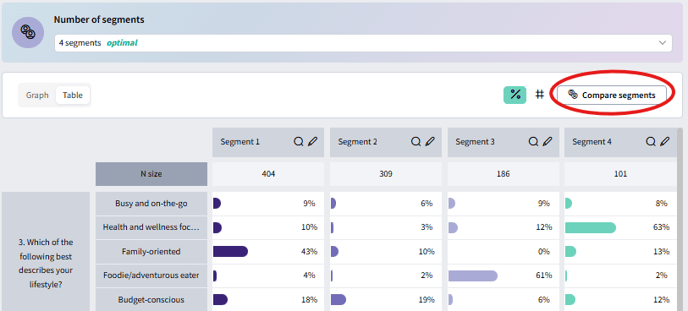
- Switch between percentages and counts with the “%” and “#” buttons.
Managing Results
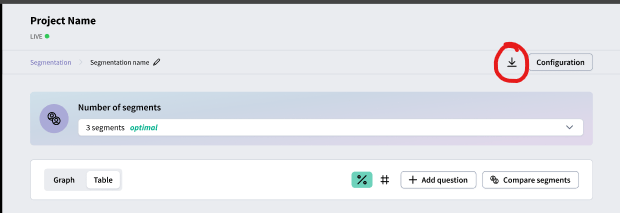
Export: Click the Export button to download your segmentation results and configuration to an Excel document.