What’s on this page:
- What is a Conjoint Experiment?
- When to Use a Conjoint Experiment
-
Setting Up a Conjoint Experiment in SightX
- Attributes and levels
- Conditional attributes
-
Optional advanced configurations
- The “None of these” option
- Pairs to exclude
- Include and exclude products
- Create the products to show to respondents
- What will respondents see?
- Sample Size
-
What are the outputs of a conjoint experiment in SightX?
-
Conjoint simulator
- Segmentation tool
- Market share tool
- Demand curves tool
-
Conjoint simulator
What is a Conjoint Experiment?
A conjoint experiment is a statistical analysis technique designed to uncover the value people assign to different aspects of a product. It is especially useful when you’re in the process of developing new products or services, and you’re uncertain about which features matter most or least to consumers. The insights gained from a conjoint experiment provide valuable guidance during the creation of new products and services, ensuring they align with consumer preferences and expectations. SightX offers a comprehensive simulator based on conjoint results that enables you to- Divide your respondents into segments with similar preferences.
- Determine the market share of products of interest.
- Analyze how changes in pricing affect the demand for products in a competitive environment.
When to Use a Conjoint Experiment
Use a conjoint experiment any time you want to measure the value that consumers place on various features of a product or service. Conjoint experiments are great for optimizing product development and for product pricing exercises, because the analysis shows how important the attributes are relative to each other, and which levels within the attributes provide consumers with the most benefit or utility.Setting Up a Conjoint Experiment in SightX
The initial step of conducting your conjoint experiment is to break down your product or service into distinctive features that may influence consumer preferences; these features are called ‘attributes’. For each attribute, you then specify its respective variations, referred to as ‘levels’. This is better explained with an example: Imagine we’re in the business of crafting sophisticated men’s dress shoes, and we’re on a mission to create new styles that truly resonate with our customers. To achieve this, we’re going to use a conjoint experiment to understand exactly what features our customers are looking for in a shoe. From experience we think that a shoe can be described by its style, material, color, and price. These will be our attributes. Based on what we can create at our factory, we define the possible levels of each attribute as follows:
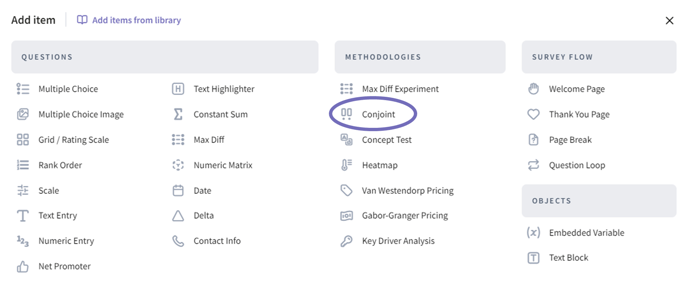
In SightX you can find Conjoint under the methodologies section when adding a new question to your project
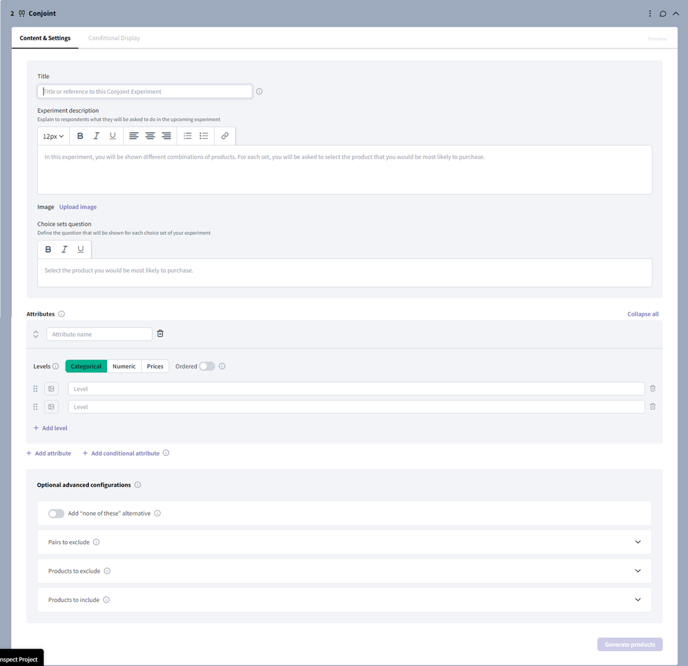
- Title: this will be used when referencing the experiment on the analysis dashboards. It will not be shown to respondents.
- Experiment description: this is a description that will be shown to respondents before the experiment commences. You can also add an image if necessary.
For example: “In this experiment, you will be shown different combinations of products. For each set, you will be asked to select the product that you would be most likely to purchase.” - Choice sets question: this is the question that will prompt users to select their preferred options. This question will be shown for each set of your experiment.
For example: “From the products displayed bellow, what is the product you would be most likely to purchase? “
Attributes and levels
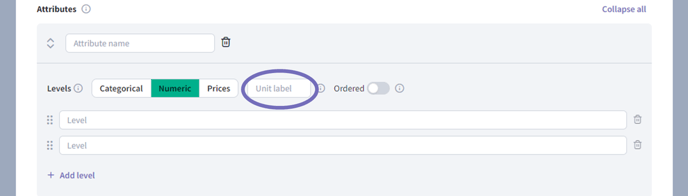
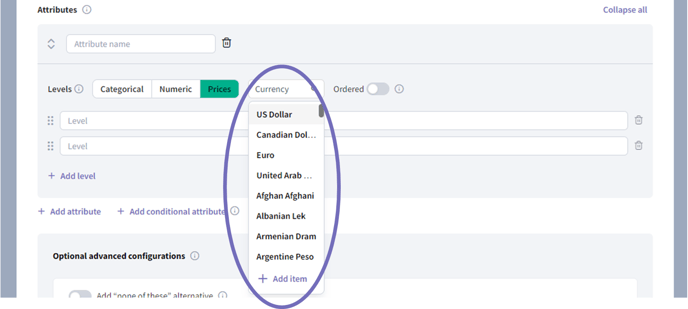
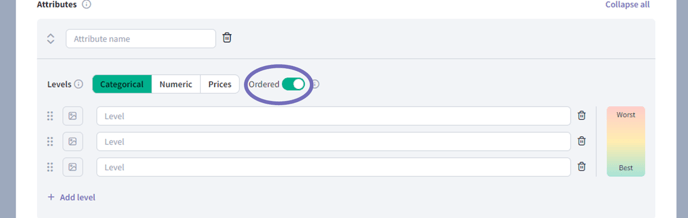
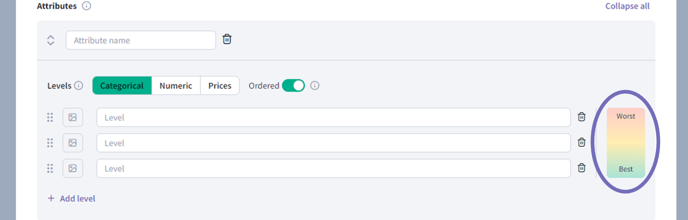
In the Attributes section you can create your attributes (you can use up to 15) and define the levels (variations) of each attribute. To add and attribute click on the ”+ Add attribute” button: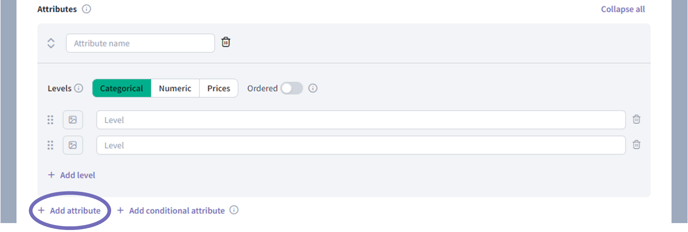
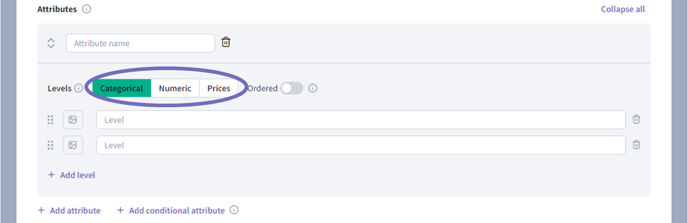
- Categorical (e.g. colors, brands, shapes).
- Numeric (e.g. weight, volume, speed).
- Prices.
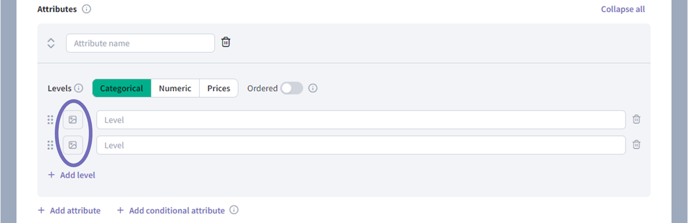
Conditional attributes
In some cases you might have an attribute whose levels depend on another attribute, we call this a conditional attribute. For example, if you sell shoes you might want to price them according to the material they use; we can define low, medium, and high levels for each material:
With this configuration, respondents will see leather shoes with prices ranging from $170 to $190, faux leather from $160 to $180, and canvas shoes from $150 to $170. You can add a conditional attribute by clicking on the + Add conditional attribute button:
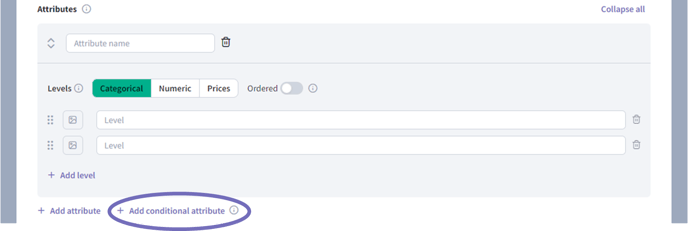
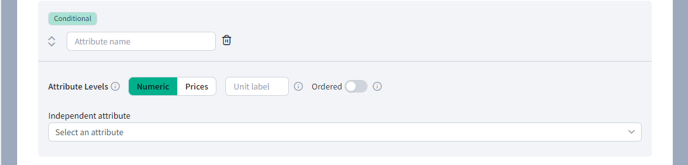
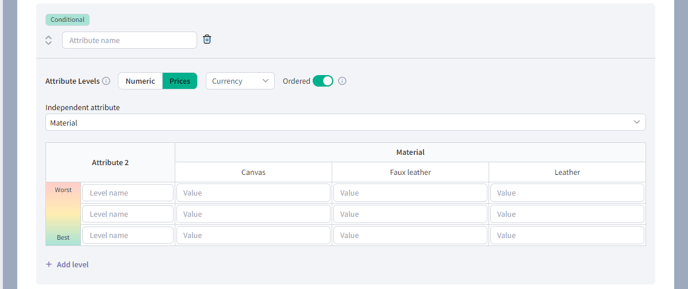
Optional advanced configurations
In some cases, you may have limitations on the products that are possible for you to create or sell. To take this into account, SightX allows you to:- Add a None of these option
- Define combinations of levels that should not __ appear in the experiment
- Define products that should not be shown.
- Define products that must be shown.
The “None of these” option
To give more flexibility to your respondents, you can allow them to not choose any of the products in a set. You can do this by adding an option to each set for I would not choose any of these products. Including this option could improve the results of your experiment by not forcing users to choose options that they would not choose in a real-life scenario. However, you may see that some respondents overuse the none option , so think carefully about whether this option would improve your study. In SightX you can add the “none” option by clicking on the Add “none of these” alternative toggle: **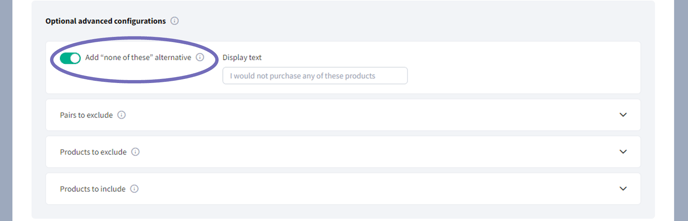
Pairs to exclude
There could be cases where a level in one attribute can’t be paired with a particular level in another attribute due to certain circumstances. In our shoe example, suppose that we cannot produce leather shoes that are sold for less than $170; as our Price attribute has the $160 level, we can specify in the Pairs to exclude section that we don’t want to see Leather paired with $160; to do this, click on + Add exclusion, select the attributes under Combinations to exclude, and indicate the excluded pair in the table that appears: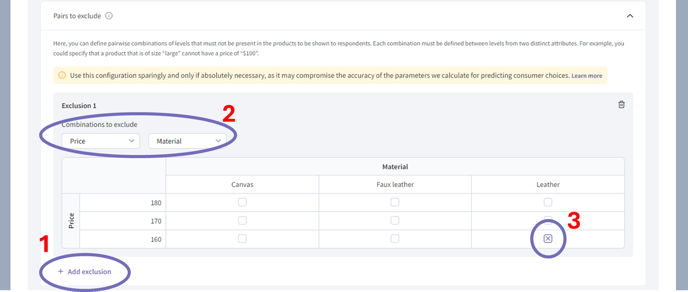
Include and exclude products
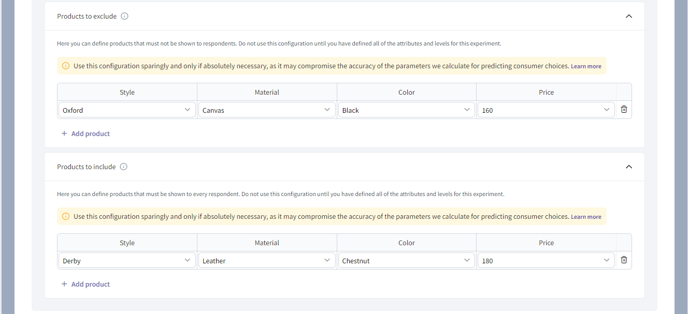
There might be cases where you want to make sure some products are shown, and some are not. For example, we might want users to see our flagship shoe:
While avoiding them to see a shoe that we cannot produce:
These products can be defined at the Products to exclude and Products to include sections:
Create the products to show to respondents
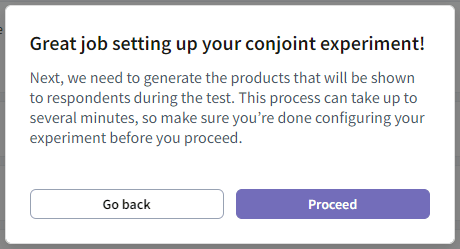
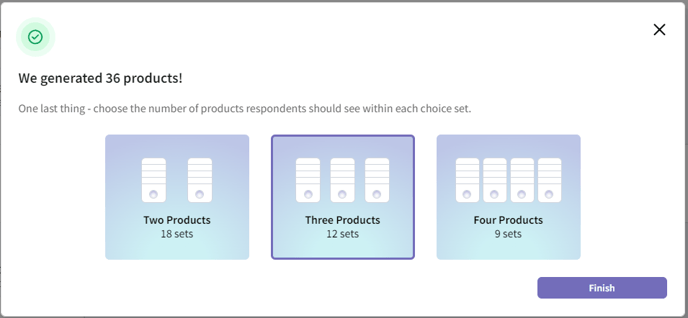
When you’ve finished setting up the experiment, click the Generate products button, and SightX will design your balanced conjoint experiment.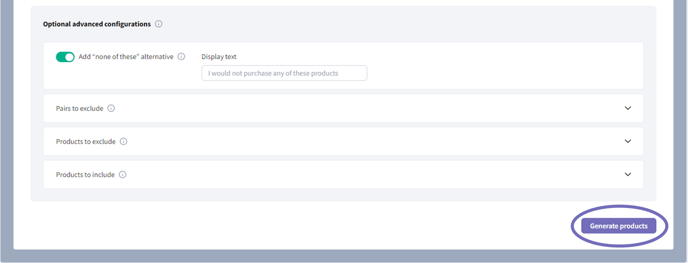
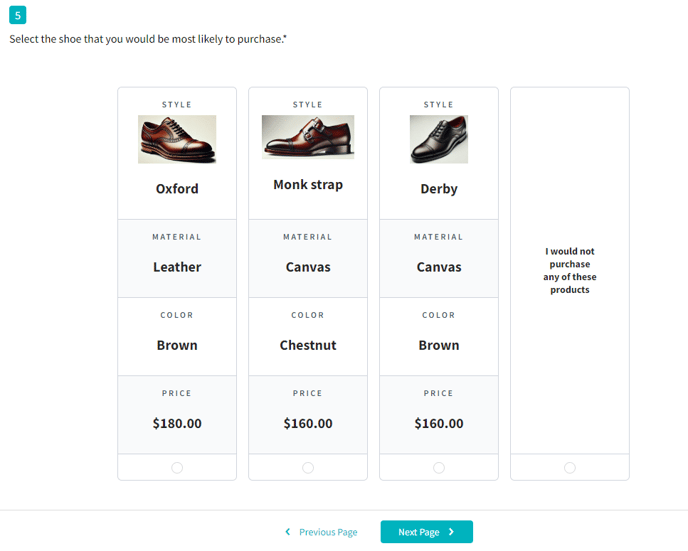
What will respondents see?
Before your respondents see the product sets, they will see and introductory page explaining the experiment (as defined in the experiment description section) .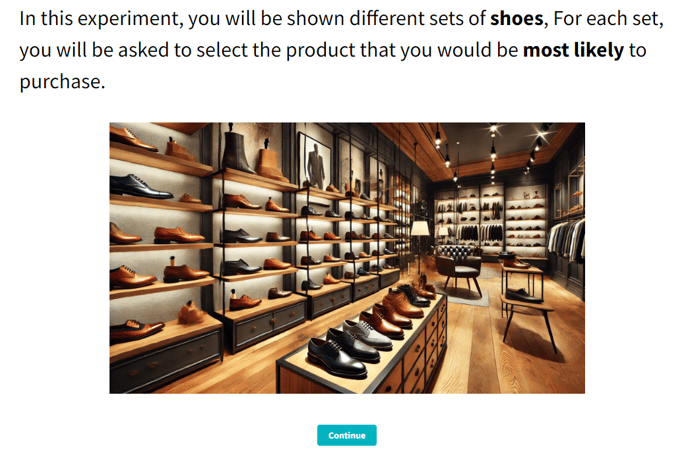
Sample Size
It’s important to include a sufficient number of respondents in your conjoint experiment. In general, the calculation for the appropriate number of respondents for a conjoint experiment is:

Calculate minimum sample size
Number of sets: Number of cards per set: Largest number of levels: Calculate sample sizeWhat are the outputs of a conjoint experiment in SightX?
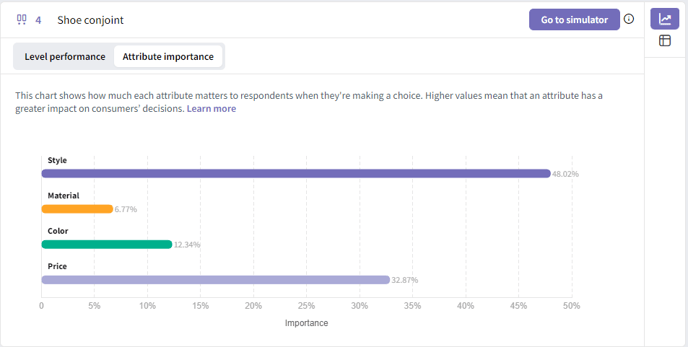
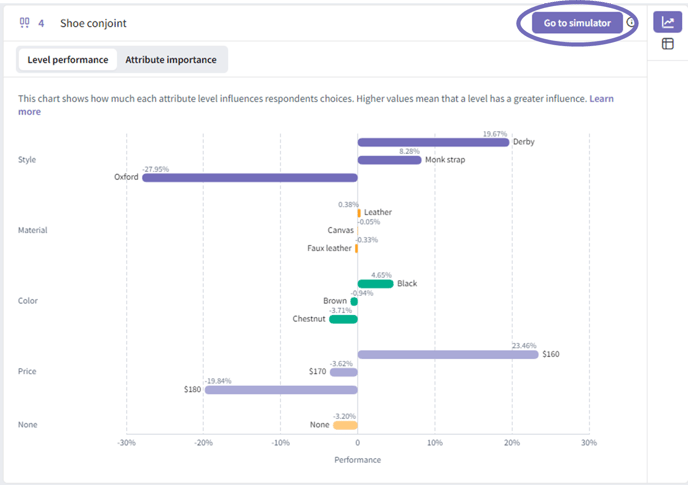
In the question analysis dashboard, you will get two graphs summarizing the results of your experiment. The first graph, Level performance , will show you how each level was valued on average by the respondents. The higher their value, the more the level is preferred.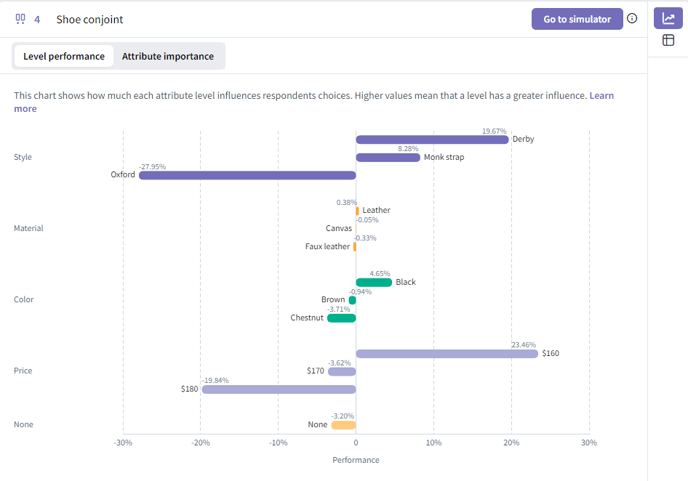
Conjoint simulator
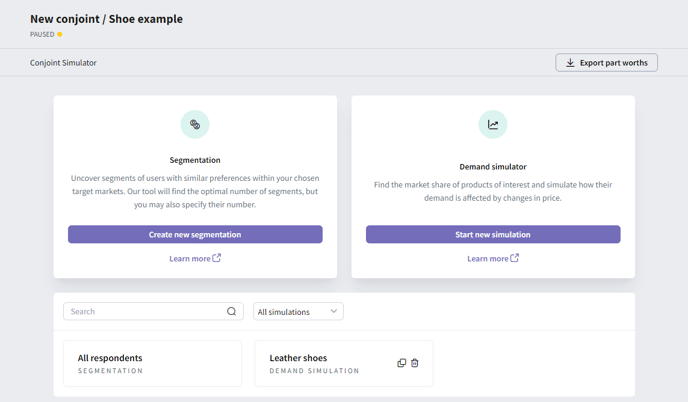
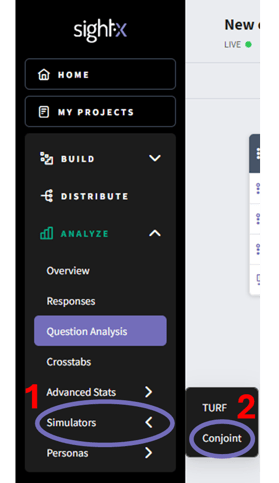
The charts presented in the question analysis section of the SightX platform give a general perspective on how consumers value the different aspects of your product. To get a deeper understanding on their preferences, use our conjoint simulator to:- Divide your respondents into segments with similar preferences.
- Determine the market share of products of interest.
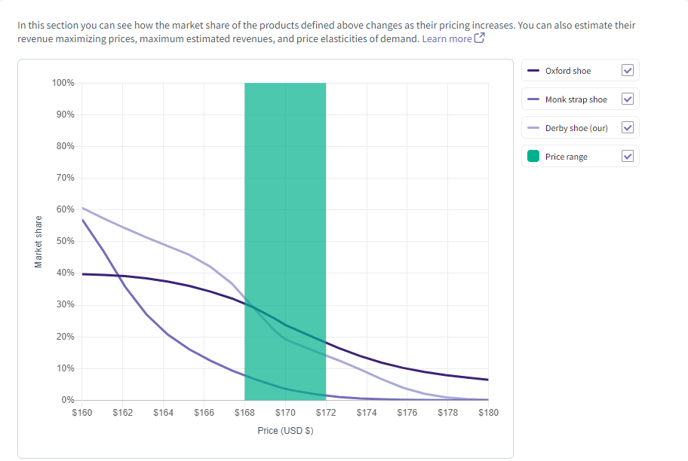
- Analyze how changes in price affect the demand for products in a competitive environment.
Segmentation tool
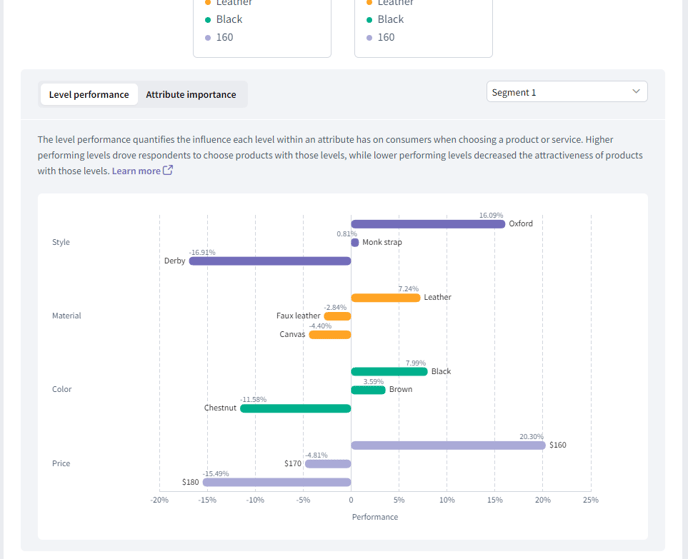
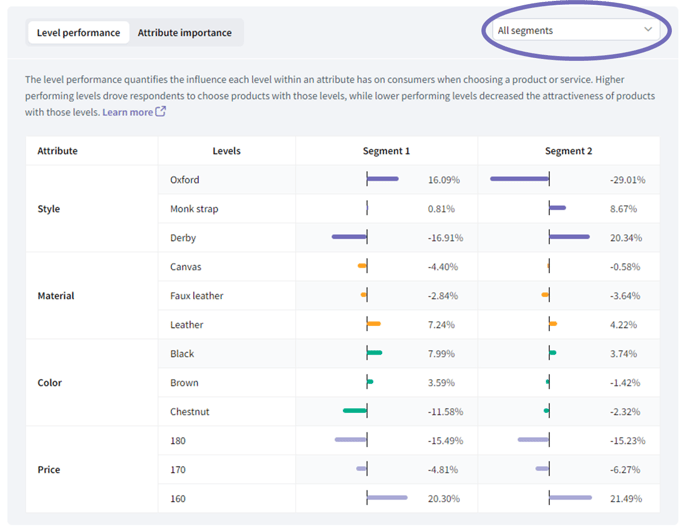
When running a conjoint experiment, your results will typically have clusters of respondents with similar preferences. For example, if we run a study about shoes, we could have a segment of people who like Oxford shoes, another segment where people prefer Derby shoes, and a segment where people are indifferent to shoe type and instead value price more. Let’s say we are interested in launching a new Oxford shoe, so our target customer will be the people who like Oxford shoes, and potentially the people who are indifferent to shoe type. From there, we would investigate the characteristics of our target segments by looking at their responses to demographic and behavioral questions in the survey. To produce the segmentation, we use latent class multinomial logit. You can get a deeper understanding of this method by reading our technical documentation. Our segmentation tool allows you to divide your surveyed population into groups based on their responses to the conjoint experiment. In the conjoint simulator page you will find a default segmentation SightX calculated using all of your responses: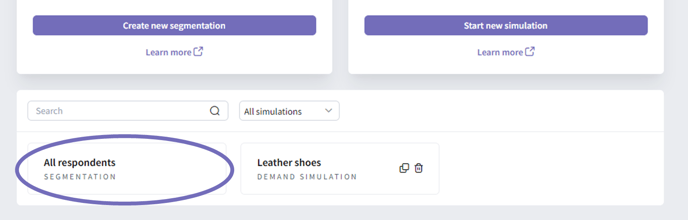
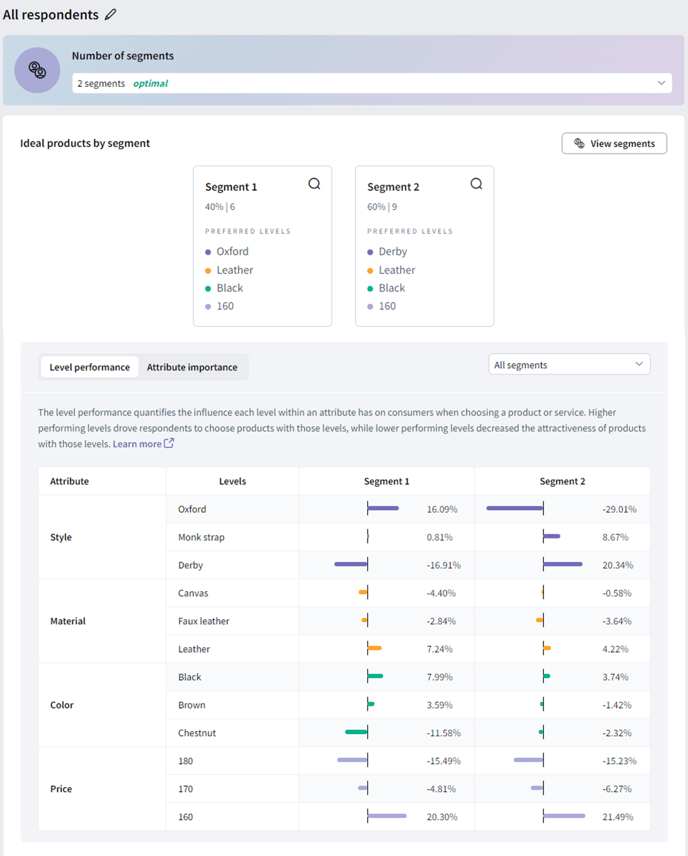
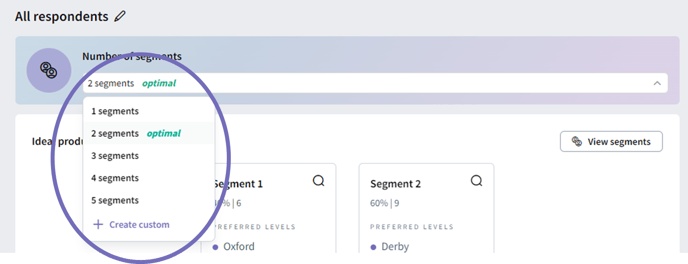
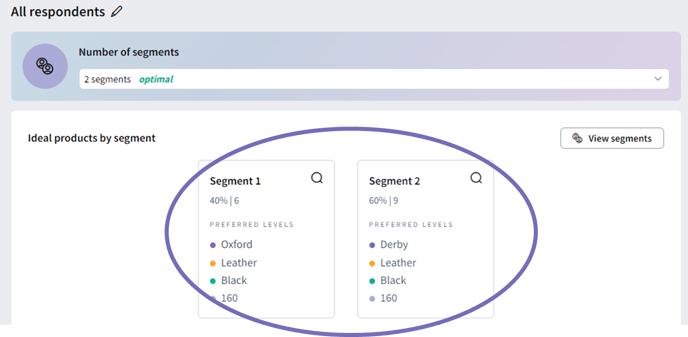
- The percentage of survey respondents in the segment.
- The number of survey respondents in the segment.
- The preferred levels in the segment.
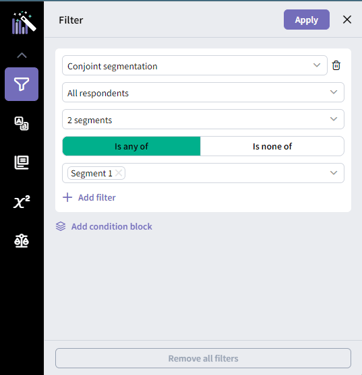
- The segment’s average valuation of each level.
- The importance of each attribute to members of the segment.
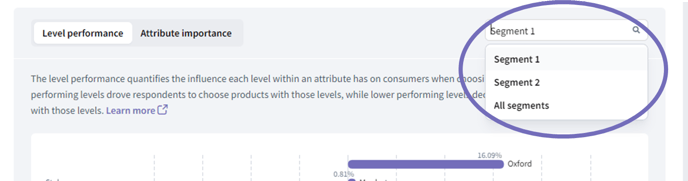
Creating a new segmentation
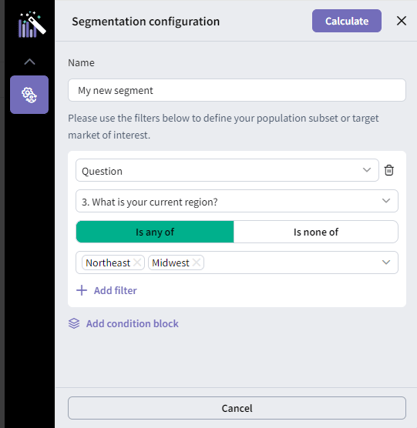
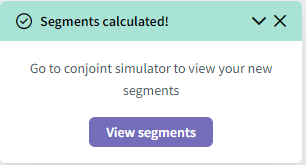
You can also calculate a segmentation within a subpopulation of interest. For example, you might be interest in finding groups of people within a specific city. To create a new segmentation, go to the conjoint simulator page and click on the Create new segmentation button: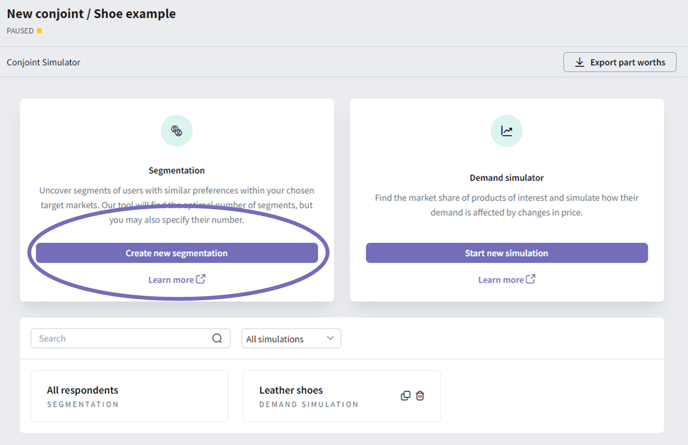
Market share tool
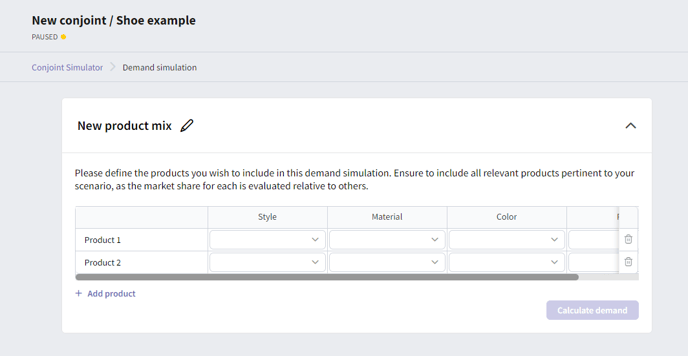
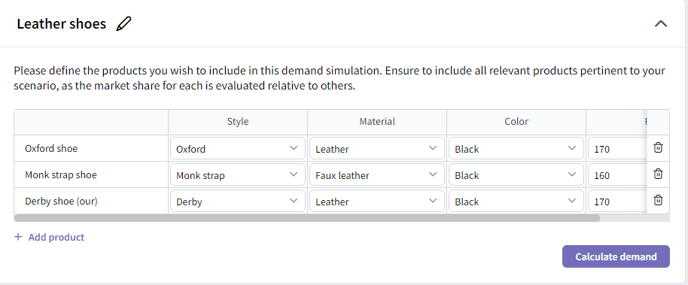
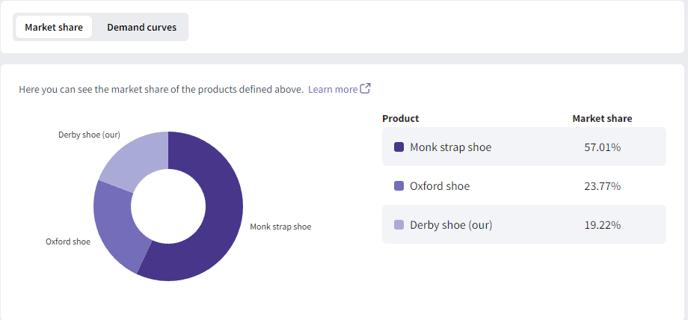
The average level performance and average attribute importance can give us important insights on how consumers value the different aspects of our product or service, but in doing so we lose information about individual preferences. Our market share tool uses individual preferences to determine what products consumers will choose when a set of products is presented to them. To start a demand simulation go to the conjoint simulator page and click on the Start new simulation button: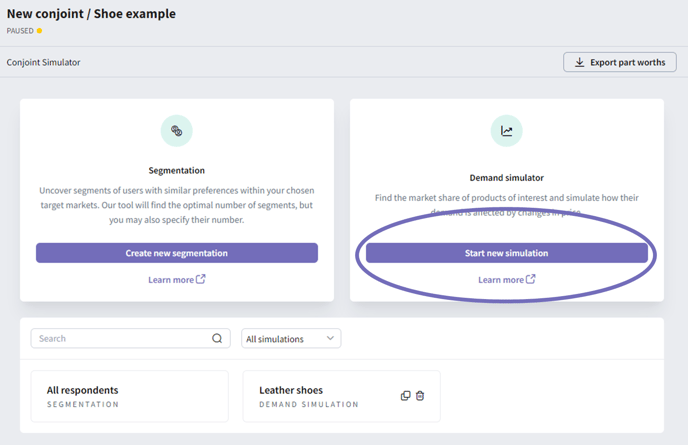
Demand curves tool
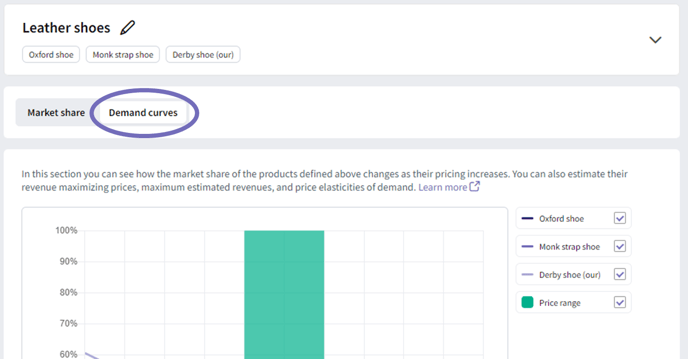
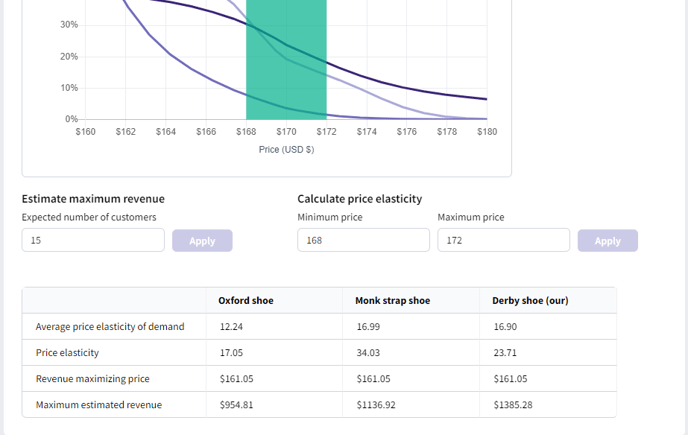
The demand curve**** simulator allows you to study how the demand for a product, competing with other products, is affected by changes in price. To view the demand curves you experiment needs to include a Price attribute. Inside your simulation click on the Demand curves tab.