What’s in this article?
- Export to Excel or Powerpoint
- Share with Users in Your Account
- Send a Dashboard Link
Export Your Analysis to Excel or Powerpoint
If you’re putting together a research report, you can easily download your analysis from SightX.- From any analysis dashboard, click the Download icon in the top menu bar.
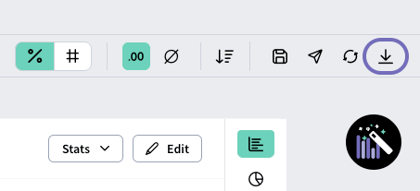
- Choose Excel to export your analyzed data tables, or PowerPoint to export the charts and visualizations to a slide deck. Note that some dashboards can only be exported to Excel.
Share the Project with Users in Your Account
If you want teammates to have full access to the project data and analytics directly in SightX, you can add them as collaborators.- Navigate to the Build section of your project, and open the Users tab. Note that you’ll need to unlock the project to add collaborators.
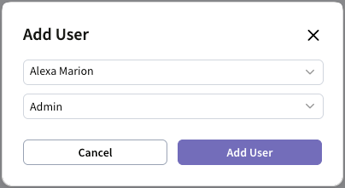
- Click the “Add user” button in the upper right corner of the page.
-
Choose the user you want to add, and assign their access role.
- Project “Admins” can share the project with other users, while “Members” cannot.
Send a Read-Only Results Dashboard Link
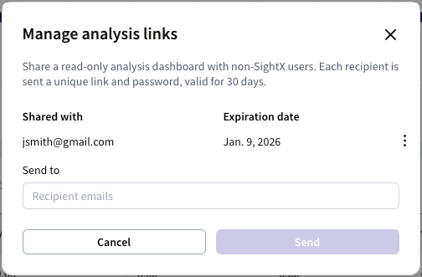
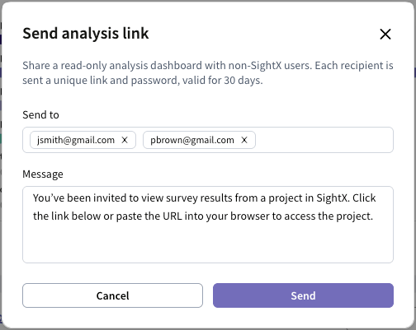
When you need to share survey results with people who aren’t SightX users, you can send a secure, view-only version of the Question Analysis (and Concept Test , if applicable) dashboard.- Navigate to the Question Analysis dashboard, and click the Send icon in the menu bar.
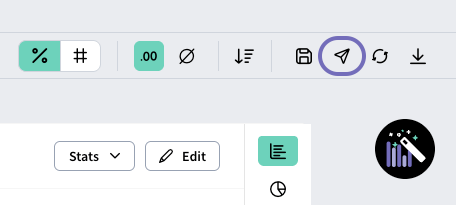
- Enter the email(s) who you wish to send the dashboard to, customize the message they’ll receive, and click “Send”.
- Download the raw data file
- Download the summary analytics to Excel and Powerpoint
- Change chart configurations (chart type, units, decimal places, sort, etc)
- Use analysis toolbox functions (filter, compare, apply sig testing, etc)
- View simulations or crosstabs
- Delete responses