

What’s on this page:
- Analyze Overview
- Exporting Raw Responses
- Data Cleaning
-
Basic Data Analysis
- Filter Data
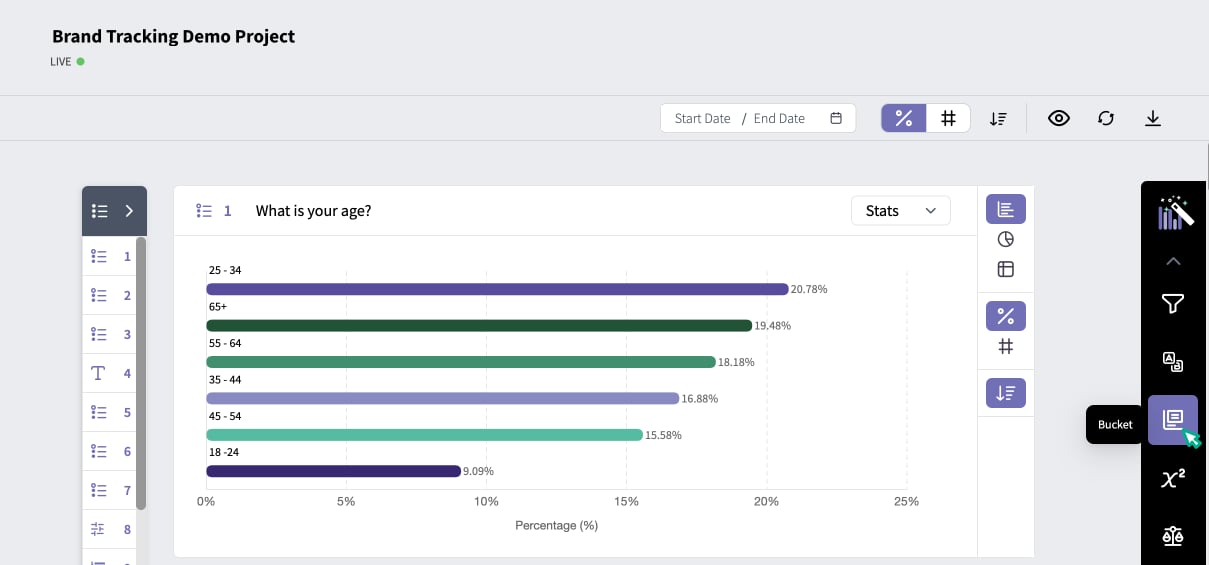
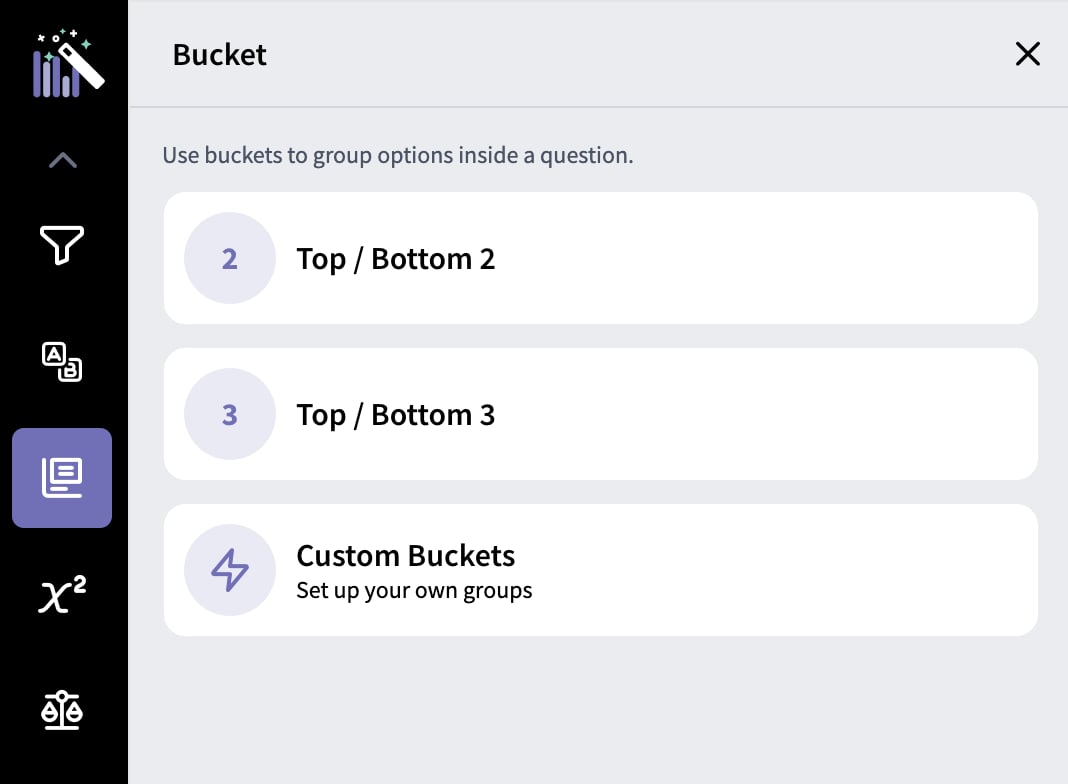
- Bucket Answer Options
- Export Analysis to Excel or PPT
- Save a View
-
Comparing Responses Across Groups
- Comparison Dashboard
- Personas
- Text Analysis
Analyze Overview
As soon as your survey starts getting responses, you’ll be able to review and analyze your data in real time in the Analyze module within your project. To start, click on the Analyze tab on the left navigation menu. First, you’ll land on the Overview page where you can see high-level information about your survey delivery including the total number of responses, the average time to complete the survey, and the chronological and geographic distribution of your responses.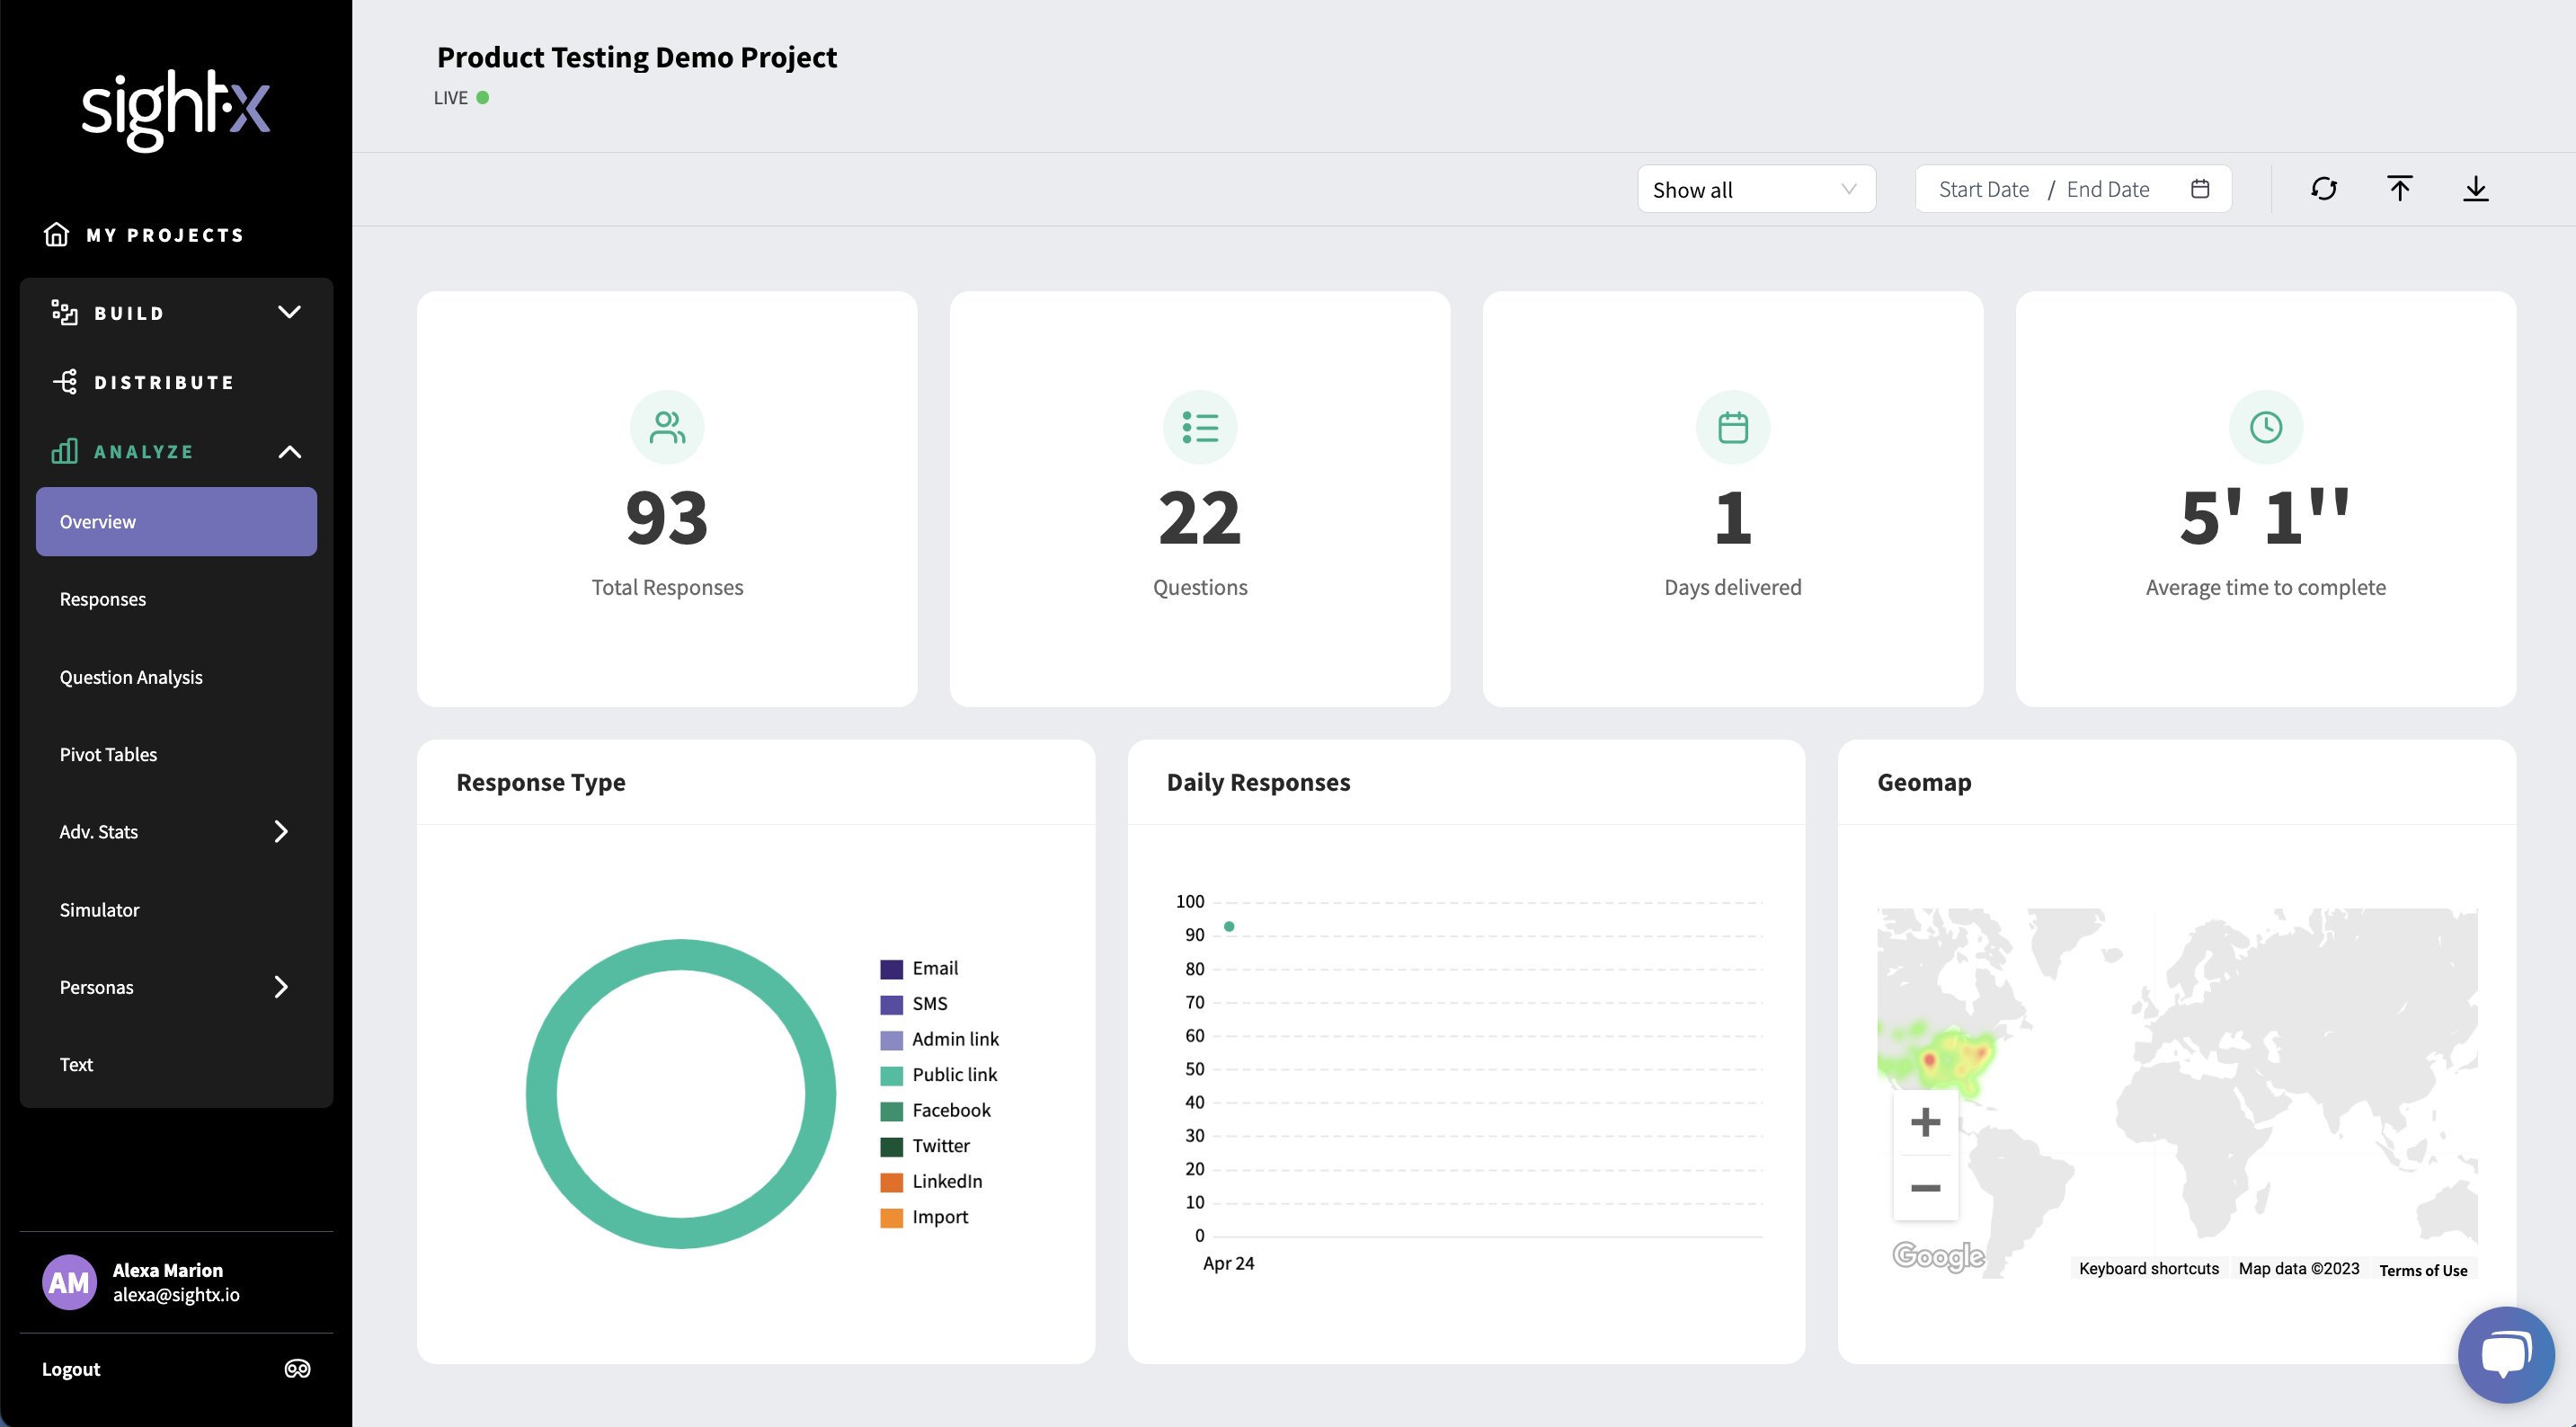
Exporting Raw Responses
From the Overview page, you can export your raw survey responses to either Excel or SPSS. Simply click the Export icon in the upper right corner of the page, and select the format you want to export your data in.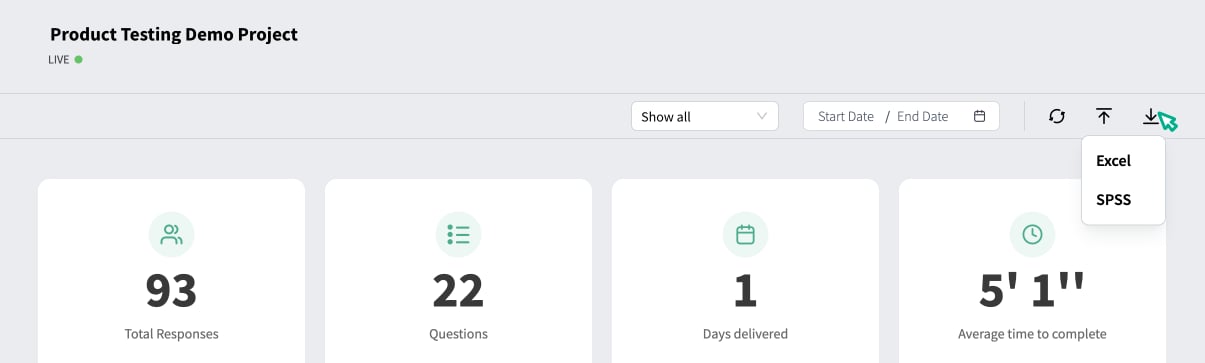
Data Cleaning
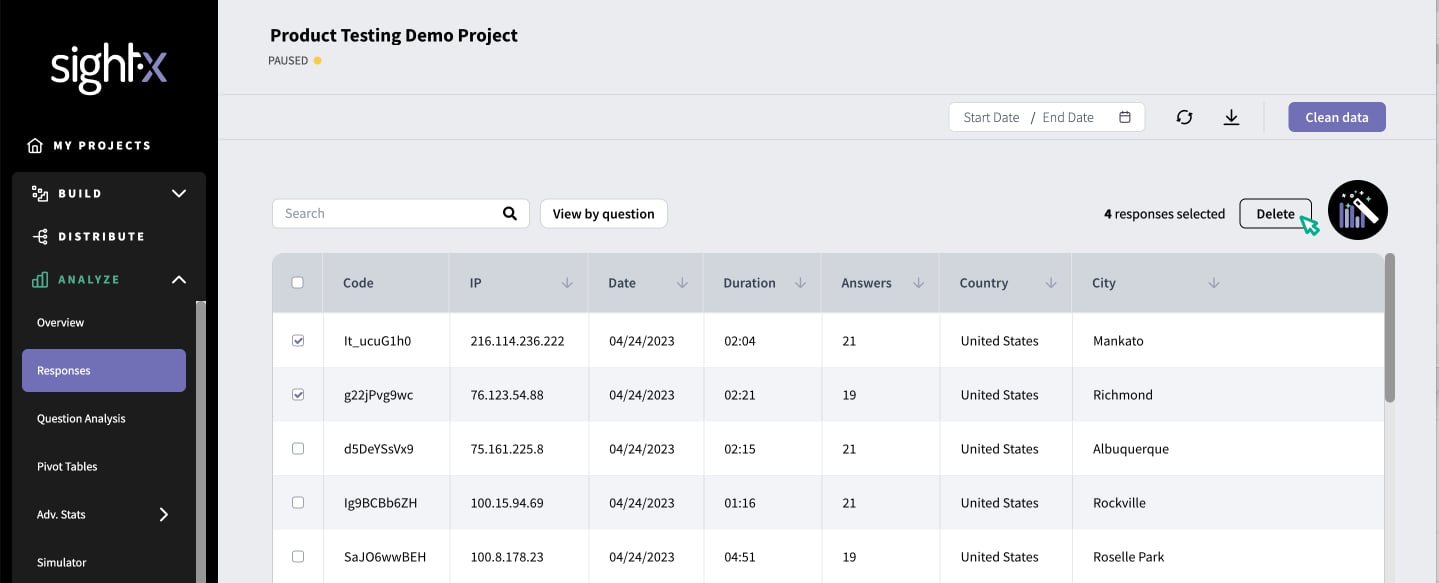
From the Responses tab in the Analyze module, you can use SightX’s automated data cleaning feature, or manually scrub out responses yourself. To delete responses, you’ll first need to pause or close your campaign in the Distribute module. Navigate to the Distribute module and click on your live campaign, and then select either “Pause” or “Close” in the upper right corner. Important Note: Once you close a campaign, you cannot open it again and the survey link associated with that campaign will no longer work. We recommend pausing your campaign when you clean your data, and only closing the campaign when you are absolutely sure you are done fielding responses for your project. Once your campaign has been paused or closed, navigate back to the Analyze module, to the Responses tab. Click on the Clean data button in the right corner of the page to initiate SightX’s automated cleaning system, which scans for interviews with duplicate or incomplete responses, and repeated IP addresses.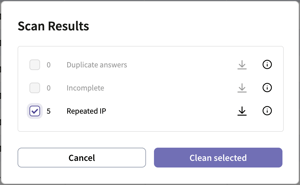
Basic Data Analysis
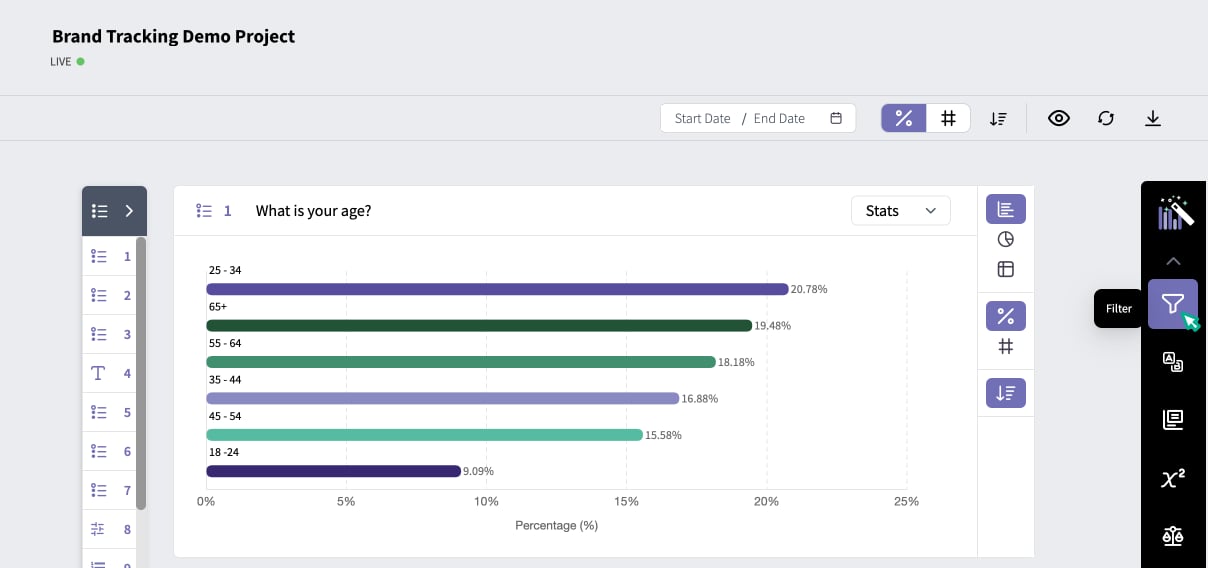
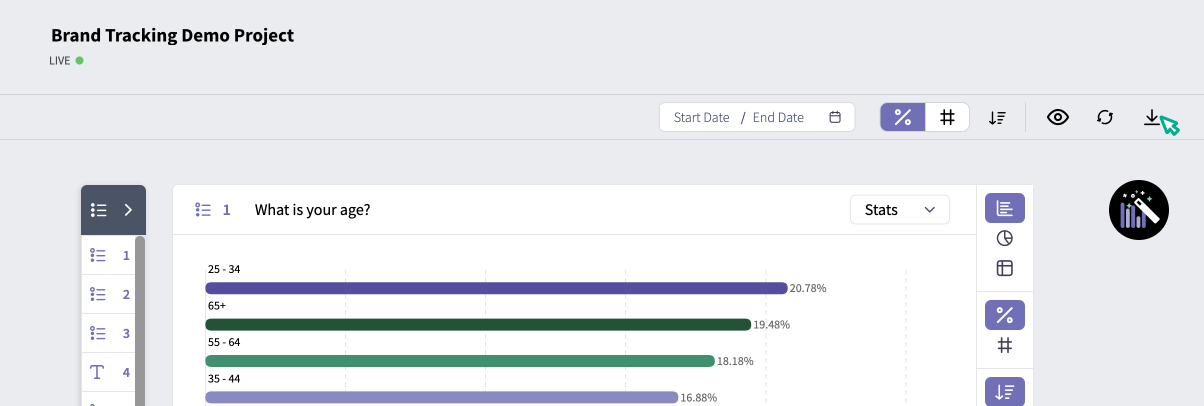
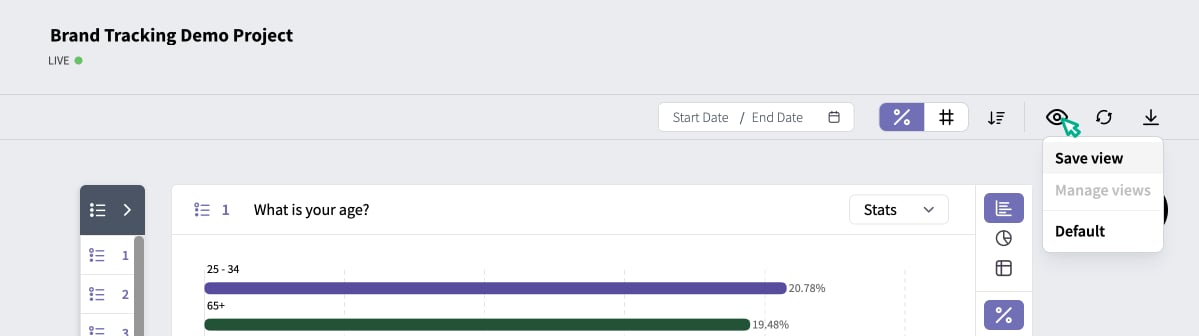
To begin analyzing your data, click on Question Analysis on the left navigation menu. On this page, you can view and configure data visualizations for each question in your survey in the following ways: Filter Data You can filter the responses shown in the data visualizations by clicking on the toolbox on the right corner of the page and selecting the Filter icon. Filters apply to all visualizations on the dashboard.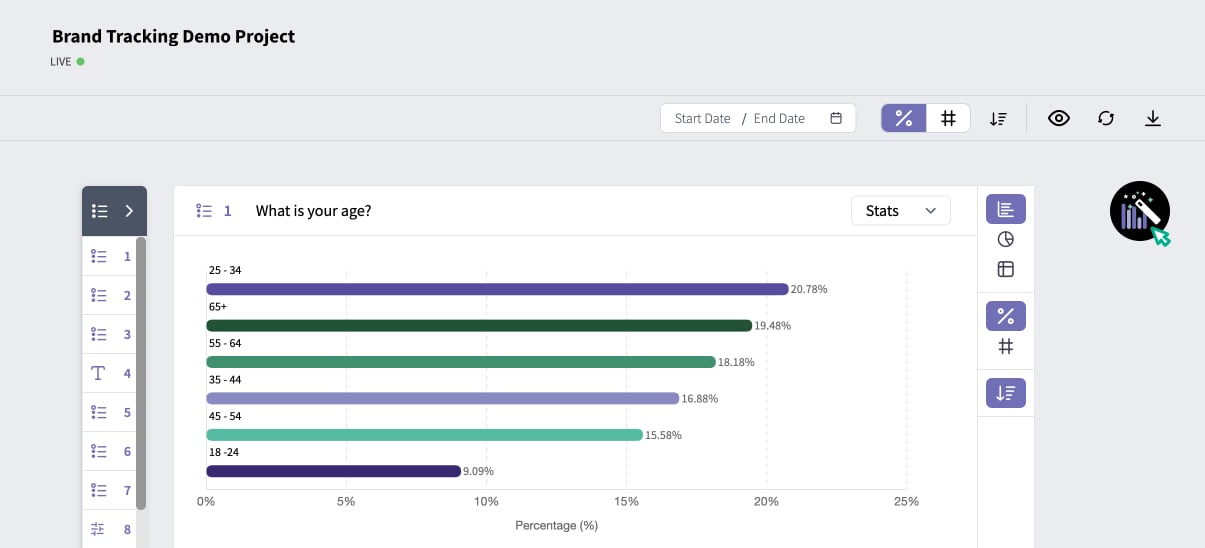
Comparing Responses Across Groups
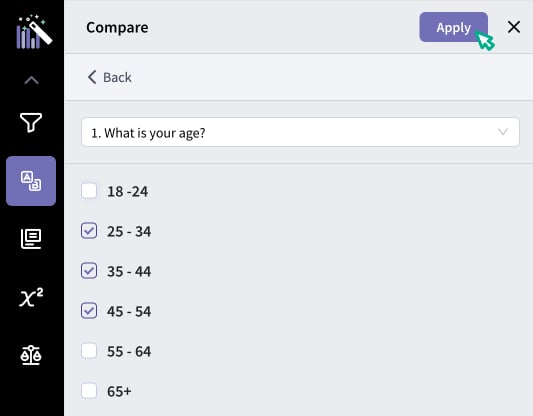
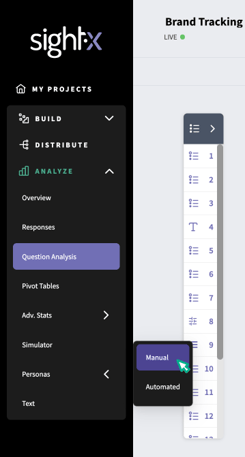
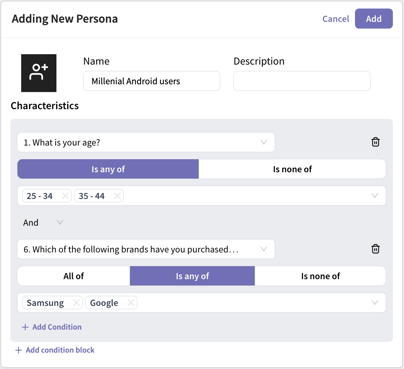
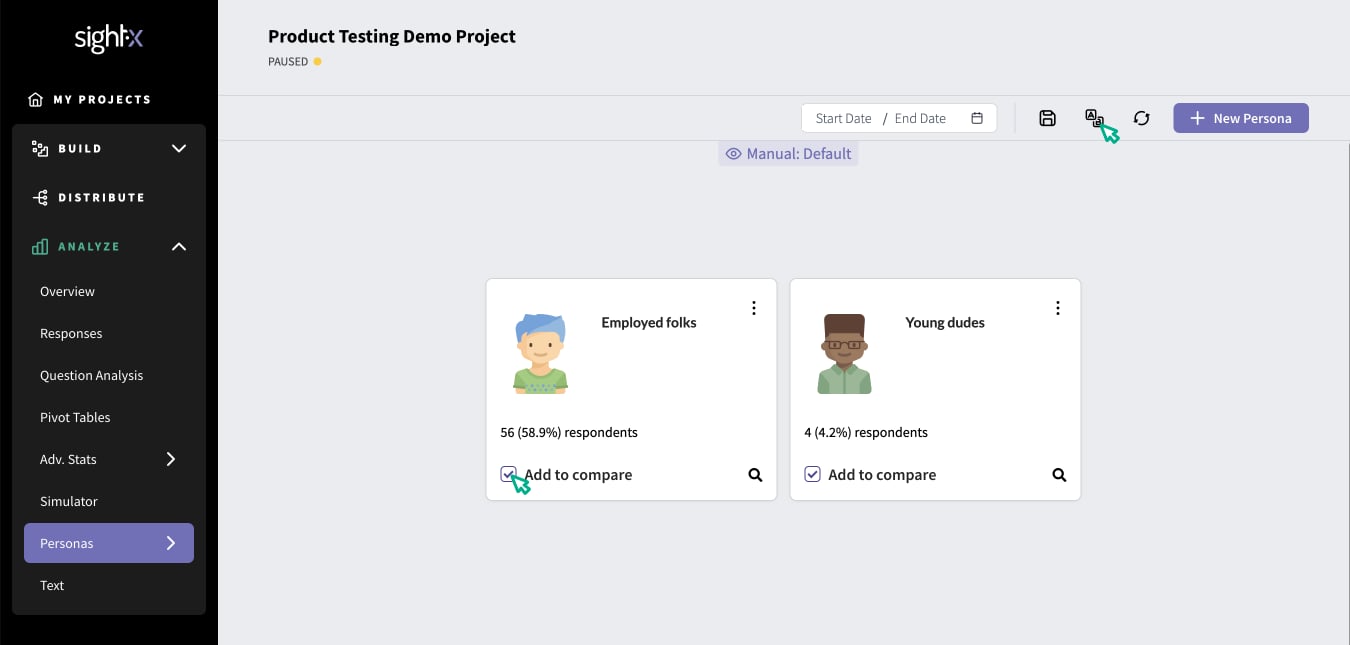
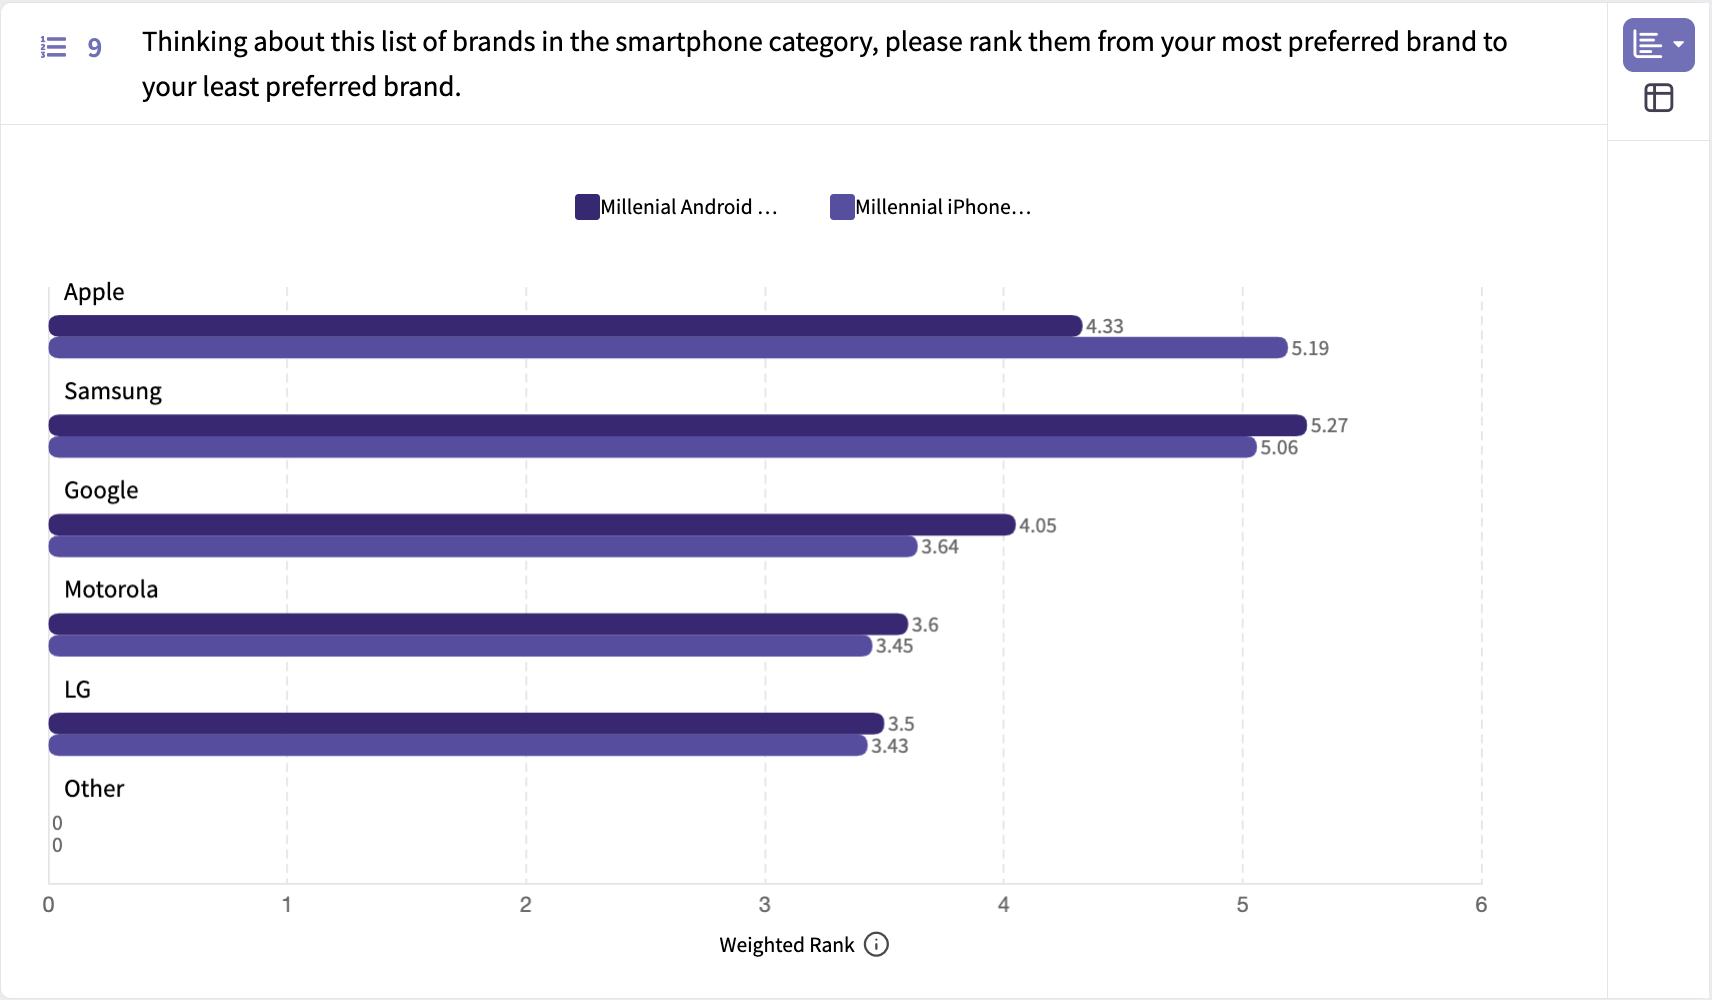
One of the things you may want to do when analyzing your data is to see how responses compare across different groups of survey participants. You can compare responses based on answers to a single question using the Comparison toolbox function, or you can compare responses based on answers to multiple questions in the Personas Dashboard. Comparison Feature To compare data across respondents based on their answers to a single question, navigate to the Question Analysis dashboard in the left-hand navigation menu. Click on the Analysis Toolbox and select the Comparison icon. Next, choose an item to use to group respondents for the comparison.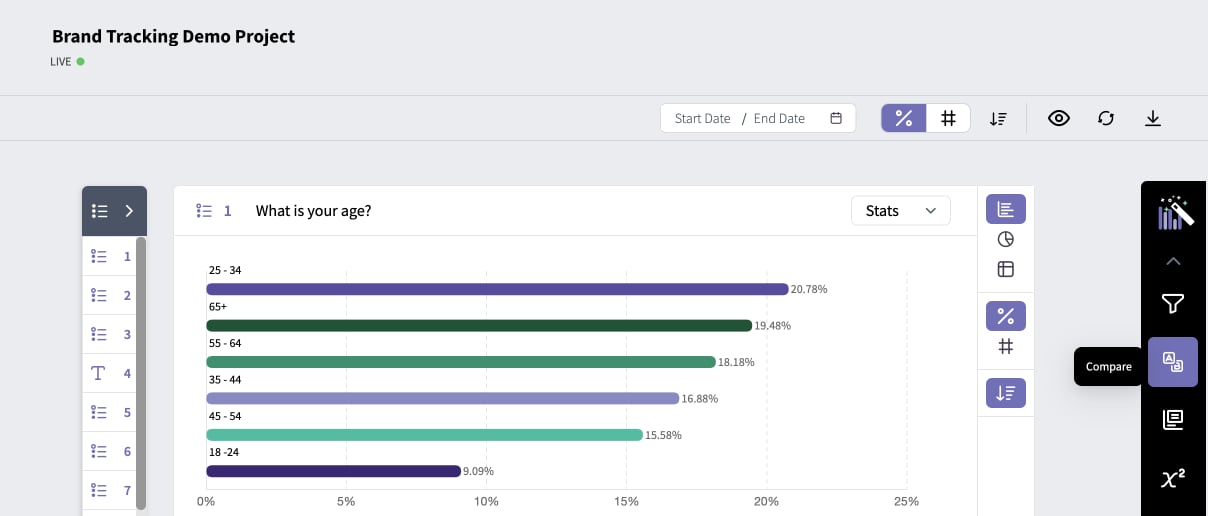
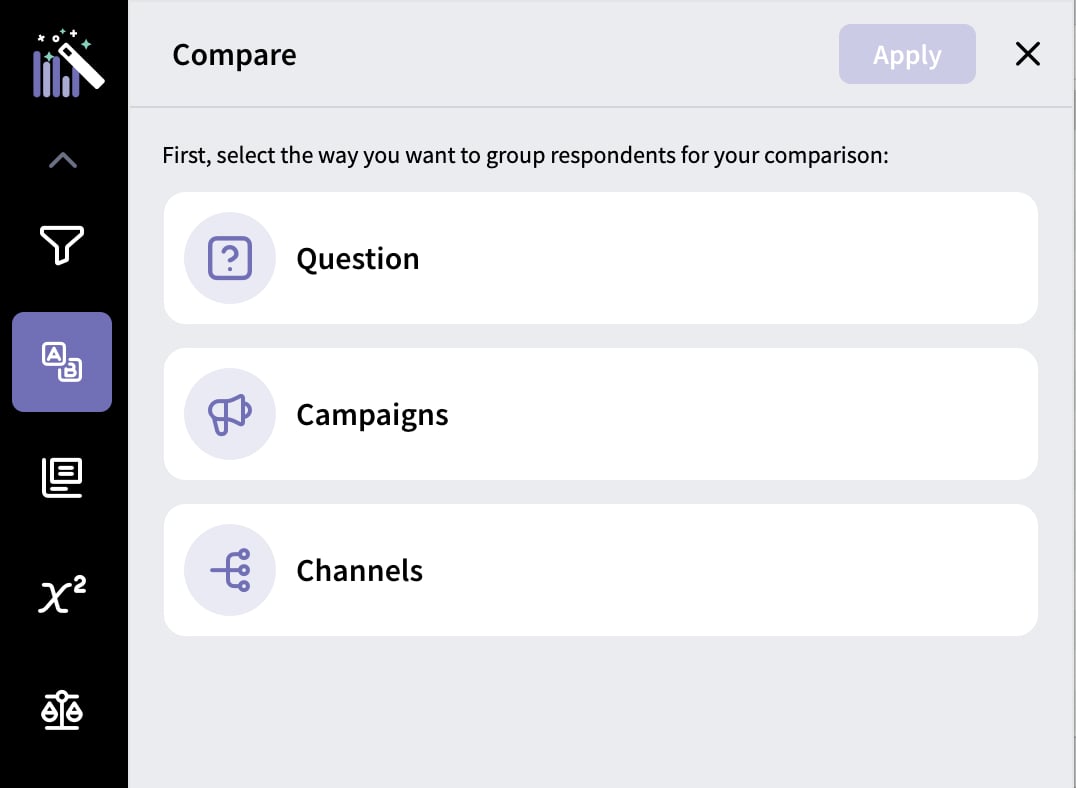
 in the upper right corner to view the data.
Text Analysis
If you have any open-response questions in your survey, you can navigate to the Text analysis dashboard for text and sentiment analytics, as well as word-clouds based on responses. Click the Text icon in the left navigation menu, and you’ll land in the dashboard.