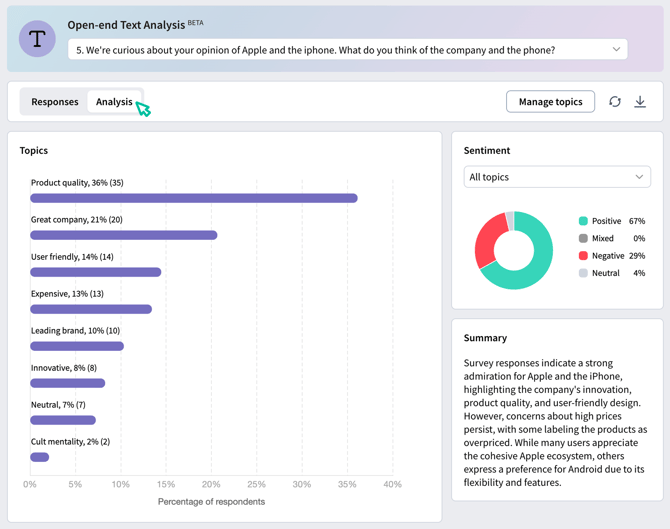
- Identify common topics across responses
- Detect overall sentiment and sentiment towards individual topics mentioned
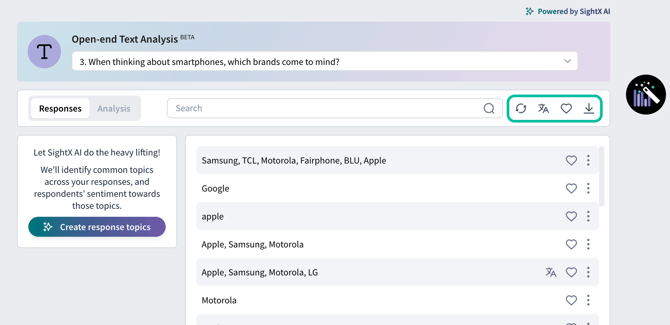
- Filter, search, and favorite responses
- View summary charts of topic and sentiment distribution
What’s in this article:
- View Text Responses
- Generate Topics and Sentiment
- View Summary Analytics
View Text Responses
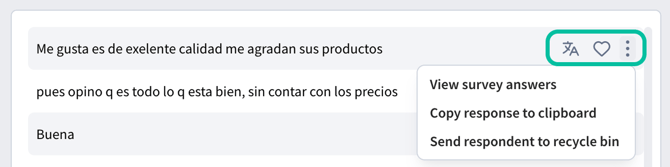
To view the open-ended responses in your survey, navigate to the Analysis section of your project and then to the Text Dashboard.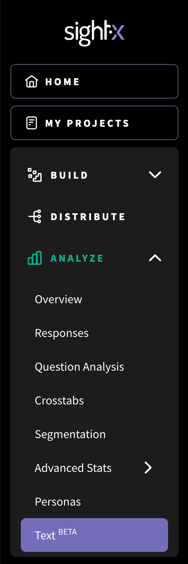
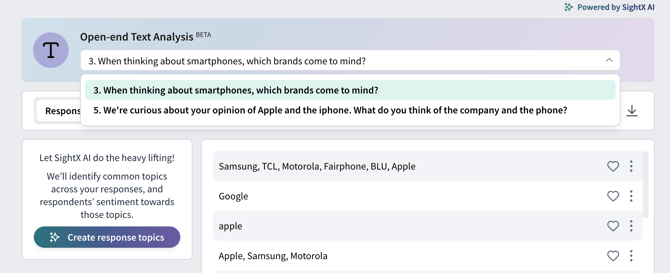
Generate Topics and Sentiment
When you’ve finished data collection, click the button to “Create response topics”. This initiates our AI prompt to identify common topics within that question, and the sentiment of each respondent towards the topics they mentioned.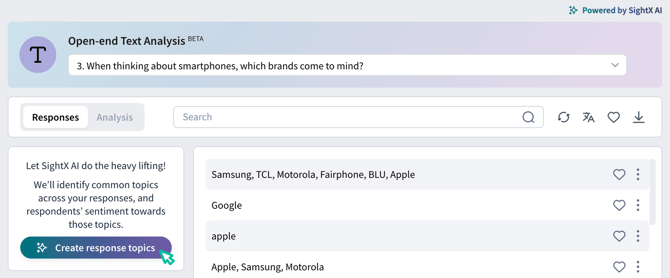
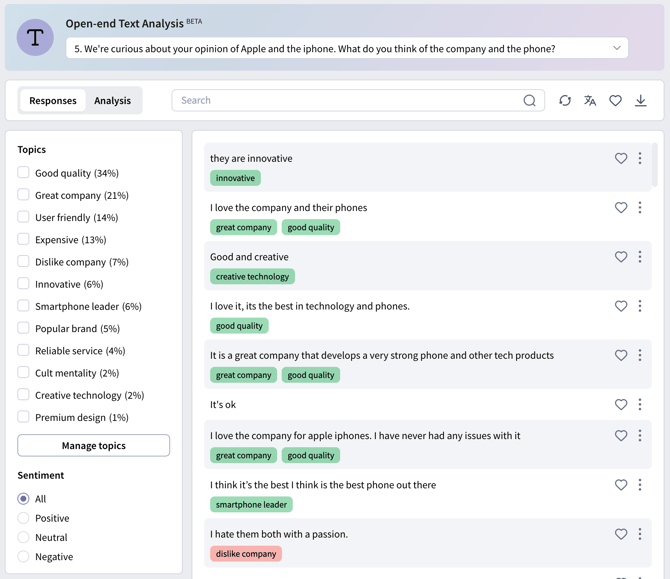
- Edit topic labels
- Combine similar topics
- Delete topics
View Summary Analytics
After you generate topics, the Analysis tab of the dashboard becomes available. Here, you’ll find quantitative charts showing the frequency of topic mentions and sentiment distribution, as well as a summary of the responses.