What is Gabor-Granger?
Gabor-Granger is a pricing methodology used in market research to examine the relationship between price and demand for products and services. While it will ultimately help you find the optimal price point, it will also show you the effect that raising or lowering your price will have on your product’s demand. It does this by giving respondents a series of nearly identical questions, the base of which being: “Would you buy [PRODUCT] for $[PRICE]?” Once the first question is posed to respondents, the subsequent questions are adapted to their answers. Presenting respondents with higher or lower prices, until they indicate a lack of purchase intent. Ultimately, these questions are designed to determine the highest price a consumer is willing to pay. Based on the responses, a demand curve is generated, showing the relationship between price and demand and highlighting an optimal price point that maximizes revenue. While there are many pricing methodologies to choose from, we would suggest choosing Gabor Granger if:- You have an established price range but need to pinpoint an exact price. (If you need to establish a price range, we’d suggest using a Van Westendorp.)
- You want to understand the price sensitivity surrounding your product or category.
- You need to understand the role price will play in the demand for your product.
Gabor-Granger with SightX
With SightX, finding the price point that maximizes your revenue is simple. After creating a new project, you’ll start in the BUILD section. There, you can select “Gabor-Granger Pricing” from the Add Item menu.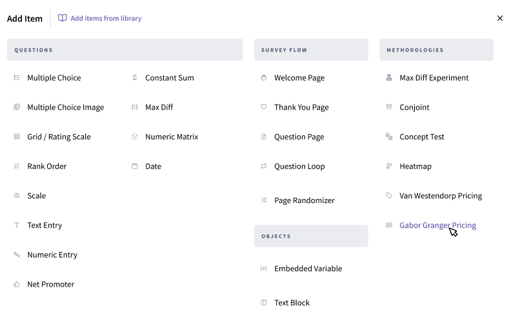
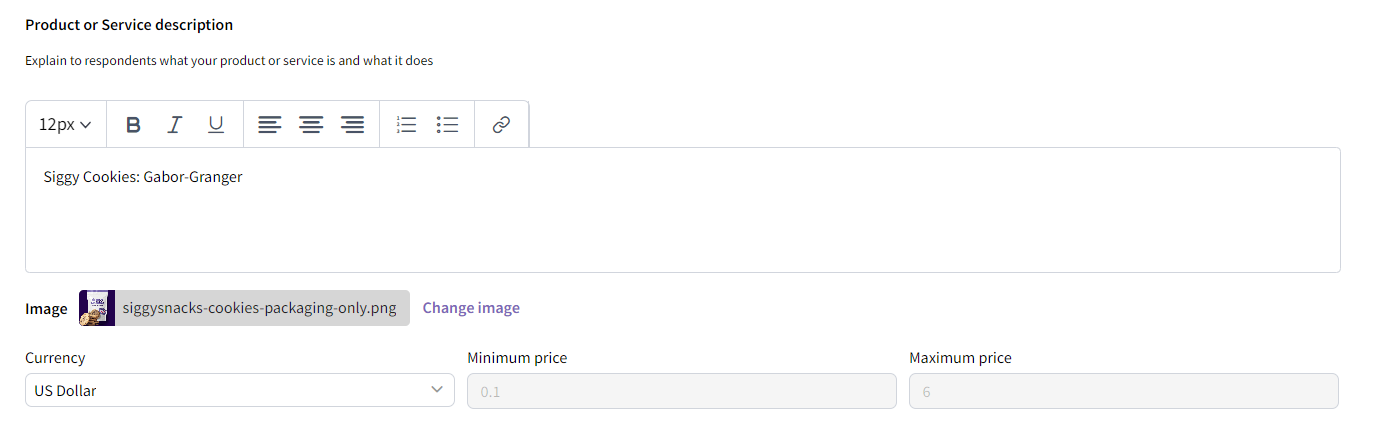
Optimize Your Gabor-Granger Pricing Strategy with SightX
Key Terms**:**- Price Elasticity of Demand: measures how much the demand for a product will change if the price of that product increases or decreases.
- Elastic Demand: the demand for the product will change substantially if the price changes.
- Inelastic Demand: the demand for the product will not change much if the price changes.
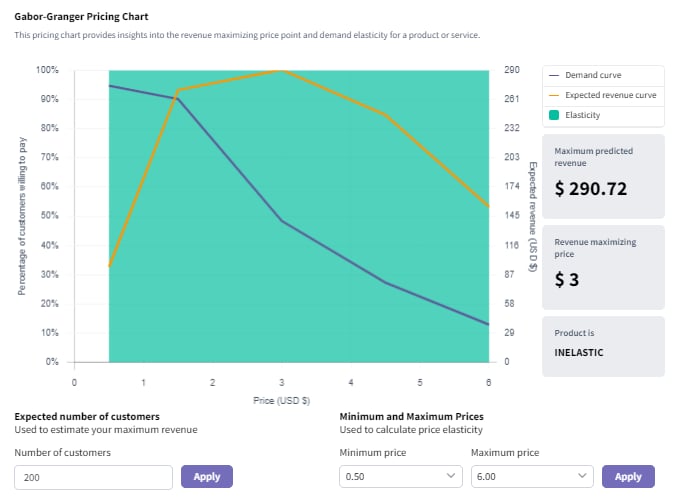
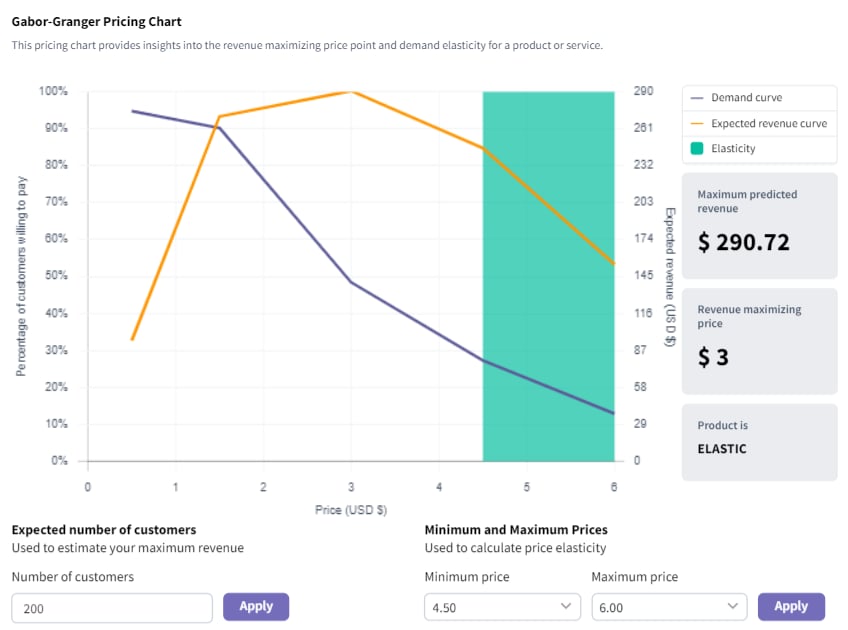
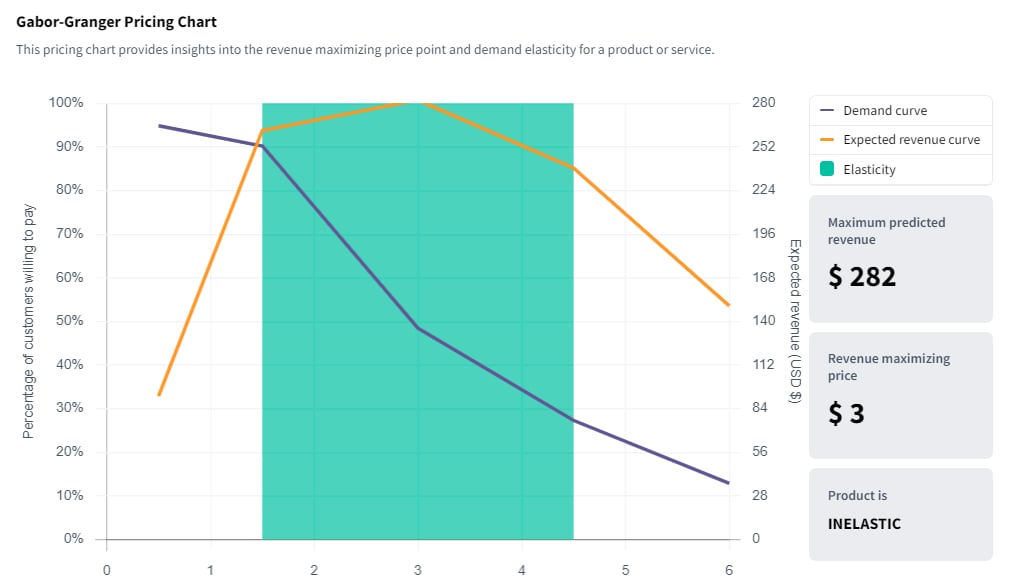
 Demand Curve: this is constructed by taking the percent of shoppers who would purchase the product at the specified price points. Hover on the demand curve to see the price and demand. For example, in the image on the right, 90% of shoppers would buy the product at $1.50.
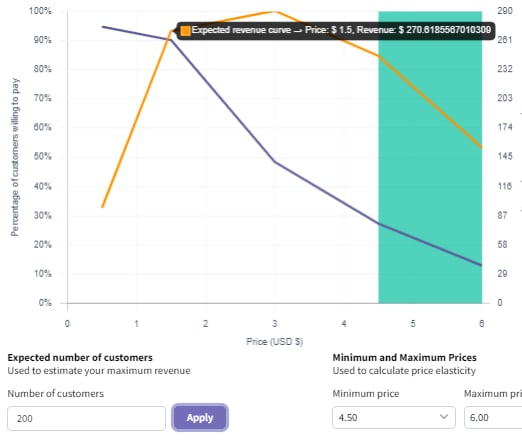
- Expected Revenue Curve: this is constructed by multiplying the demand by its corresponding price point. It indicates the expected revenue at each of the specified price points for a given number of customers. Hover on the demand curve to see the price and expected revenue. For example, in the image on the left, we expect to have a revenue of 1.5 and had around 200 customers. Changing the number of customers will update this curve; if you surveyed 200 respondents but expect to have 100,000 customers in practice, you can adjust the number in the Number of Customers input box to see what revenue to expect.
- Elasticity: this shows
 the price range for which the elasticity of the demand for the product is being calculated. For example, in the image on the right, the demand for the product between 3 is inelastic. This means that increasing the price from 3 will not have a significant impact on the demand for the product.
- Revenue Maximizing Price: this is the price at which your product will yield the highest revenue.
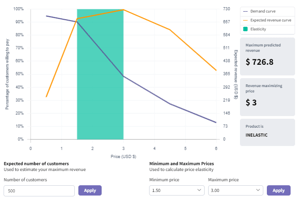
- Maximum Predicted Revenue: this is the estimated revenue for the product based on the Revenue Maximizing Price and the Expected Number of Customers. For example, in the image on the left, if we expect to have 500 customers purchasing our product, the maximum predicted revenue is 3) by the number of customers who would buy the product at that price point (i.e., 0.4845 * 500). In this example, there are 500 expected customers. The demand for the product at 3 yields the $726.8 maximum predicted revenue. Changing the number of expected customers will change the maximum predicted revenue.
- Use the Purchase Intent question provided or create your own earlier in the survey when setting up a Gabor-Granger exercise. In most cases, since the Gabor-Granger exercise will assess respondents’ willingness to pay for your product, you will want to only ask people who are likely to purchase your product to assess its price.
-
- Only display the Gabor-Granger exercise to those who are likely to purchase your product. Asking respondents who are unlikely to purchase your product to complete a Gabor-Granger exercise could result in skewed data as people who are unlikely to purchase a product might devalue it in comparison to those who would purchase it.
- Have between 5 and 8 price points for more comprehensive results.
- For robust results, we recommend a minimum base size of 100. Results with fewer than 100 completes are directional.