- What is Sample Weighting?
- When to Weight Sample in Data Analysis
- Applying Weighting to Data in SightX
- Weighting Multiple Variables
- Creating Nested Weights in a Weighting Schema
- Creating Multiple Weights in a Weighting Schema
- Adjusting or Recalculating Weights
- Types of Weighting Used in SightX
- Cell-based Weighting
- Raked/RIM Weighting
- Weighting Efficiency Score (WES)
What is Sample Weighting?
In research studies, survey data can become skewed when certain segments within a population are over or under represented in the sample. Even the most well-planned projects can end up with too many respondents from a single gender, age group, or ethnicity. Weighting is a statistical technique applied to a sample to adjust for biases and achieve better representation of your target audience.When to Weight Sample in Data Analysis
You can use weighting when your sample skews considerably from the actual population or target audience. For example, suppose you’re conducting research for a meal kit subscription box, and the sample composition ended up with 30% plant-based eaters and 70% meat eaters. You know that plant-based eaters only make up 10% of the population, so you would apply weighting so that the responses from plant-based eaters aren’t over-represented in your data.Applying Weighting to Data in SightX
To weight data in a SightX project, navigate to the Question Analysis or Crosstabs pages in the Analysis module. Click the magic toolbox icon in the right corner of the dashboard, and then click on the purple Weighting icon.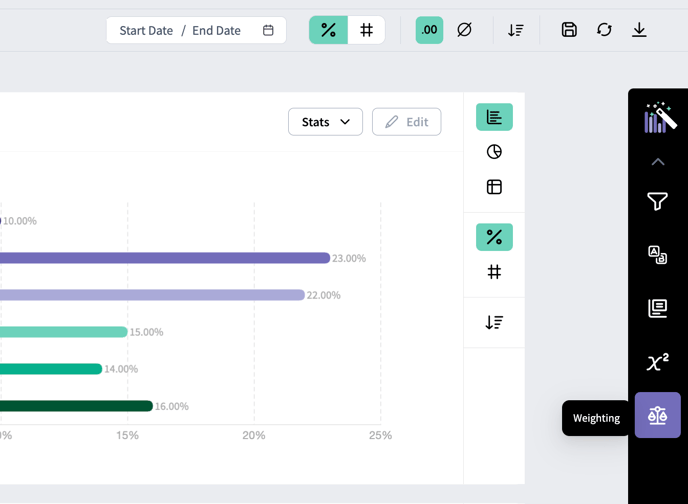

Weighting Multiple Variables
You may want to weight responses based on more than one variable. You can do this in two ways: by nesting both variables in a single weight, OR by creating two separate weights. Nesting variables is appropriate when you know the exact proportions you want of each nested group. For example, in our case of the meal kit subscription survey, let’s say we know that in the general population the breakdowns of each dietary type by each gender are as follows:
Females represent both a greater portion of the population (51% vs 49% for males) and are also more likely to not eat meat. Therefore, it makes sense to nest the gender and diet variables into one weight so that the data reflects a real world distribution.
However, if you don’t know the dietary breakdowns by gender and only know the separate age and diet breakdowns (as shown below), you should create two separate weights.
Creating Nested Weights in a Weighting Schema
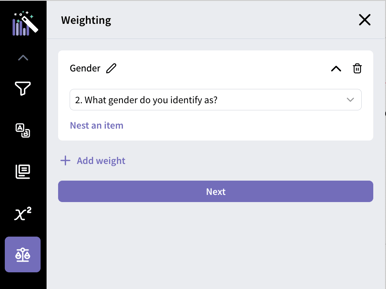
To create a nested weight in SightX, begin creating a weight in the toolbox following the steps above. Choose the first variable you want to weight, then click the “Nest an item” button underneath the variable.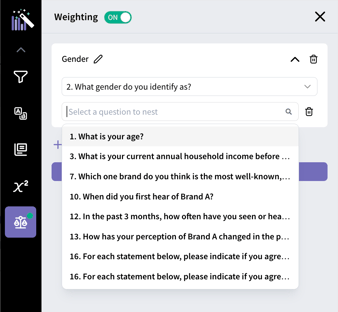
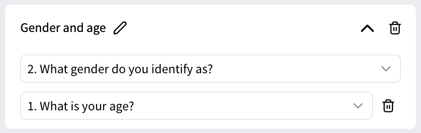
Creating Multiple Weights in a Weighting Schema
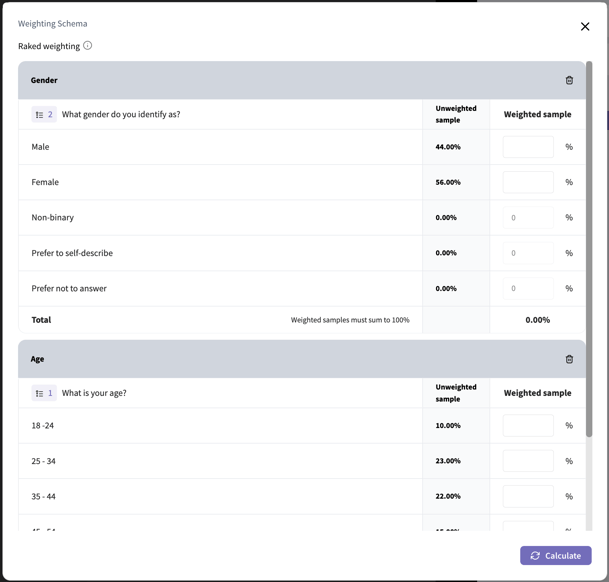
If you want to weight multiple variables, but don’t know the exact proportions of each nested population segment, you can simply create multiple weights in the toolbox. You can add additional weights by clicking the “Add item” button in the weighting toolbox, and adding as many variables as you want to weight. Once you’ve added all of the variables, click the “Next” button to proceed to the Weighting Schema modal. Here, you’ll input the weights for each variable separately. SightX’s Raked Weighting algorithm will then figure out the interlocked percentiles for each weight so that each variable is properly distributed.Viewing and Editing Weights
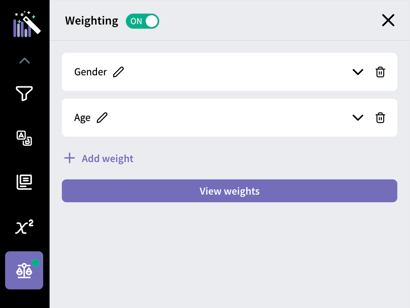
To view or edit the weights you’ve created, click on the the green weighting icon below the toolbox, or open the toolbox and navigate to the weighting section. From here, you can add more variables to your weighting schema by clicking the “Add weight” button, or click the “View weights” button to see (or edit weights in) the weighting modal. You can also toggle weighting “off” to view the data without weights without losing the weighting schema you’ve set up.