- What is a Heatmap?
- Why Use a Heatmap Experiment?
- Setting Up a Heatmap Experiment in SightX
- Heatmaps Survey Example
- Analyzing a Heatmap Experiment
- Exporting Results from Heatmap Experiment
What is a Heatmap?
Heatmaps are visual representations of respondents’ opinions, preferences, and behaviors. They are created by showing respondents an image and asking them to click on places in the image that invoke certain reactions for them. The results are delivered to a researcher in the form of a color-coded map, with hotspots showing where respondents clicked. For example, the results below allow us to see what respondents like and dislike about an ad for a product.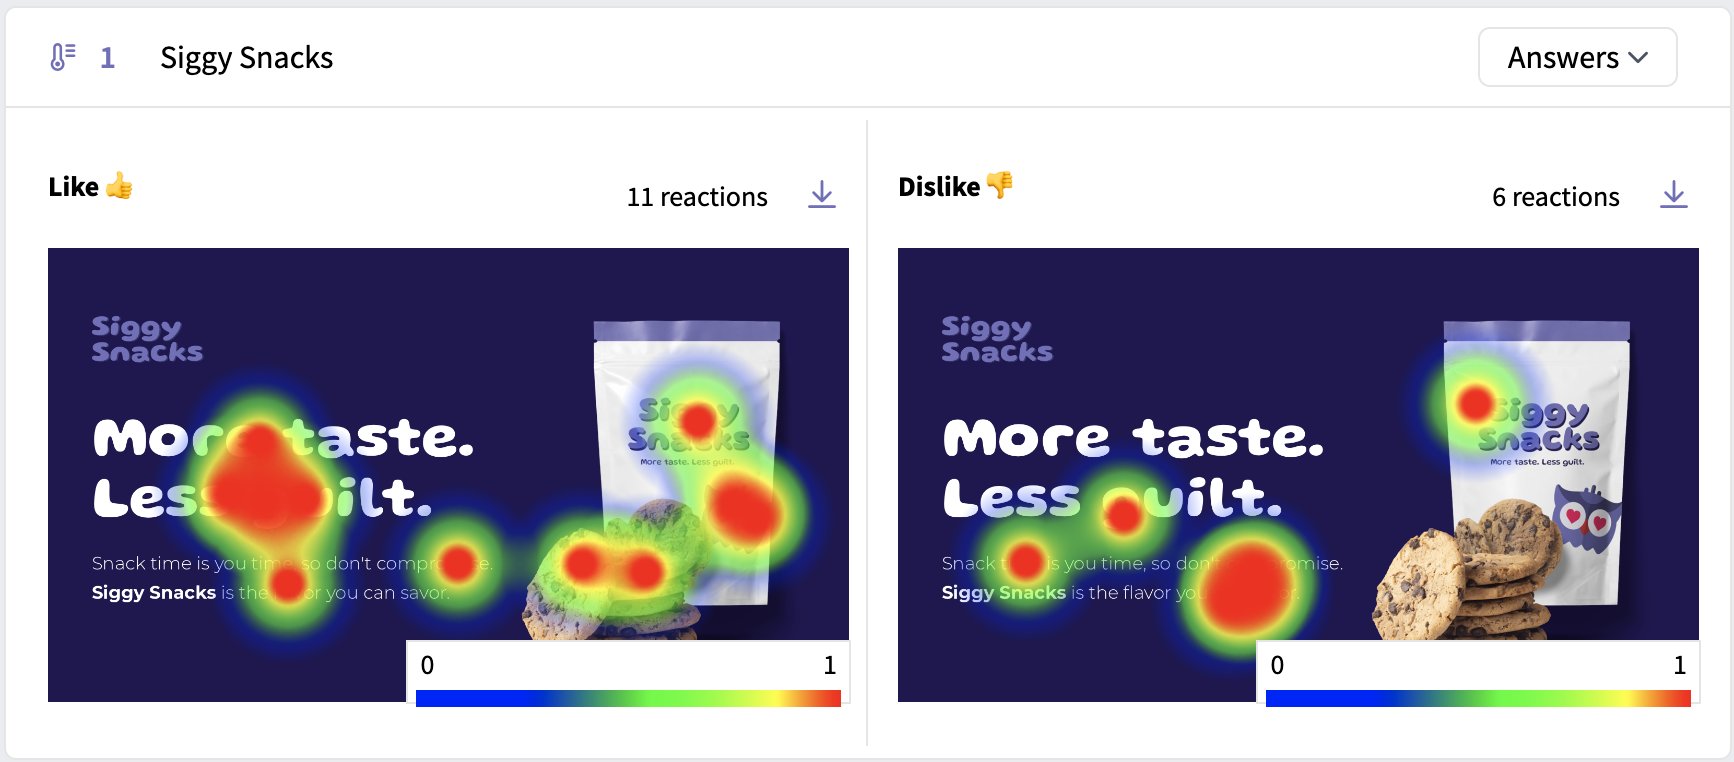
Why Use a Heatmap Experiment?
Heatmap experiments are a useful tool when you have images associated with your research. Instead of asking respondents to explain what they liked or didn’t like about an ad, product design, or concept, you can derive much better analysis by simply having respondents click on applicable areas of the image. When you aggregate the clicks of all respondents, you’re able to see clear trends in how your audience feels about your product or message.Setting Up a Heatmap Experiment in SightX
In the Build section of your project, click on the “+Add item” menu and select “Heatmap” from the list to add a Heatmap experiment to the survey.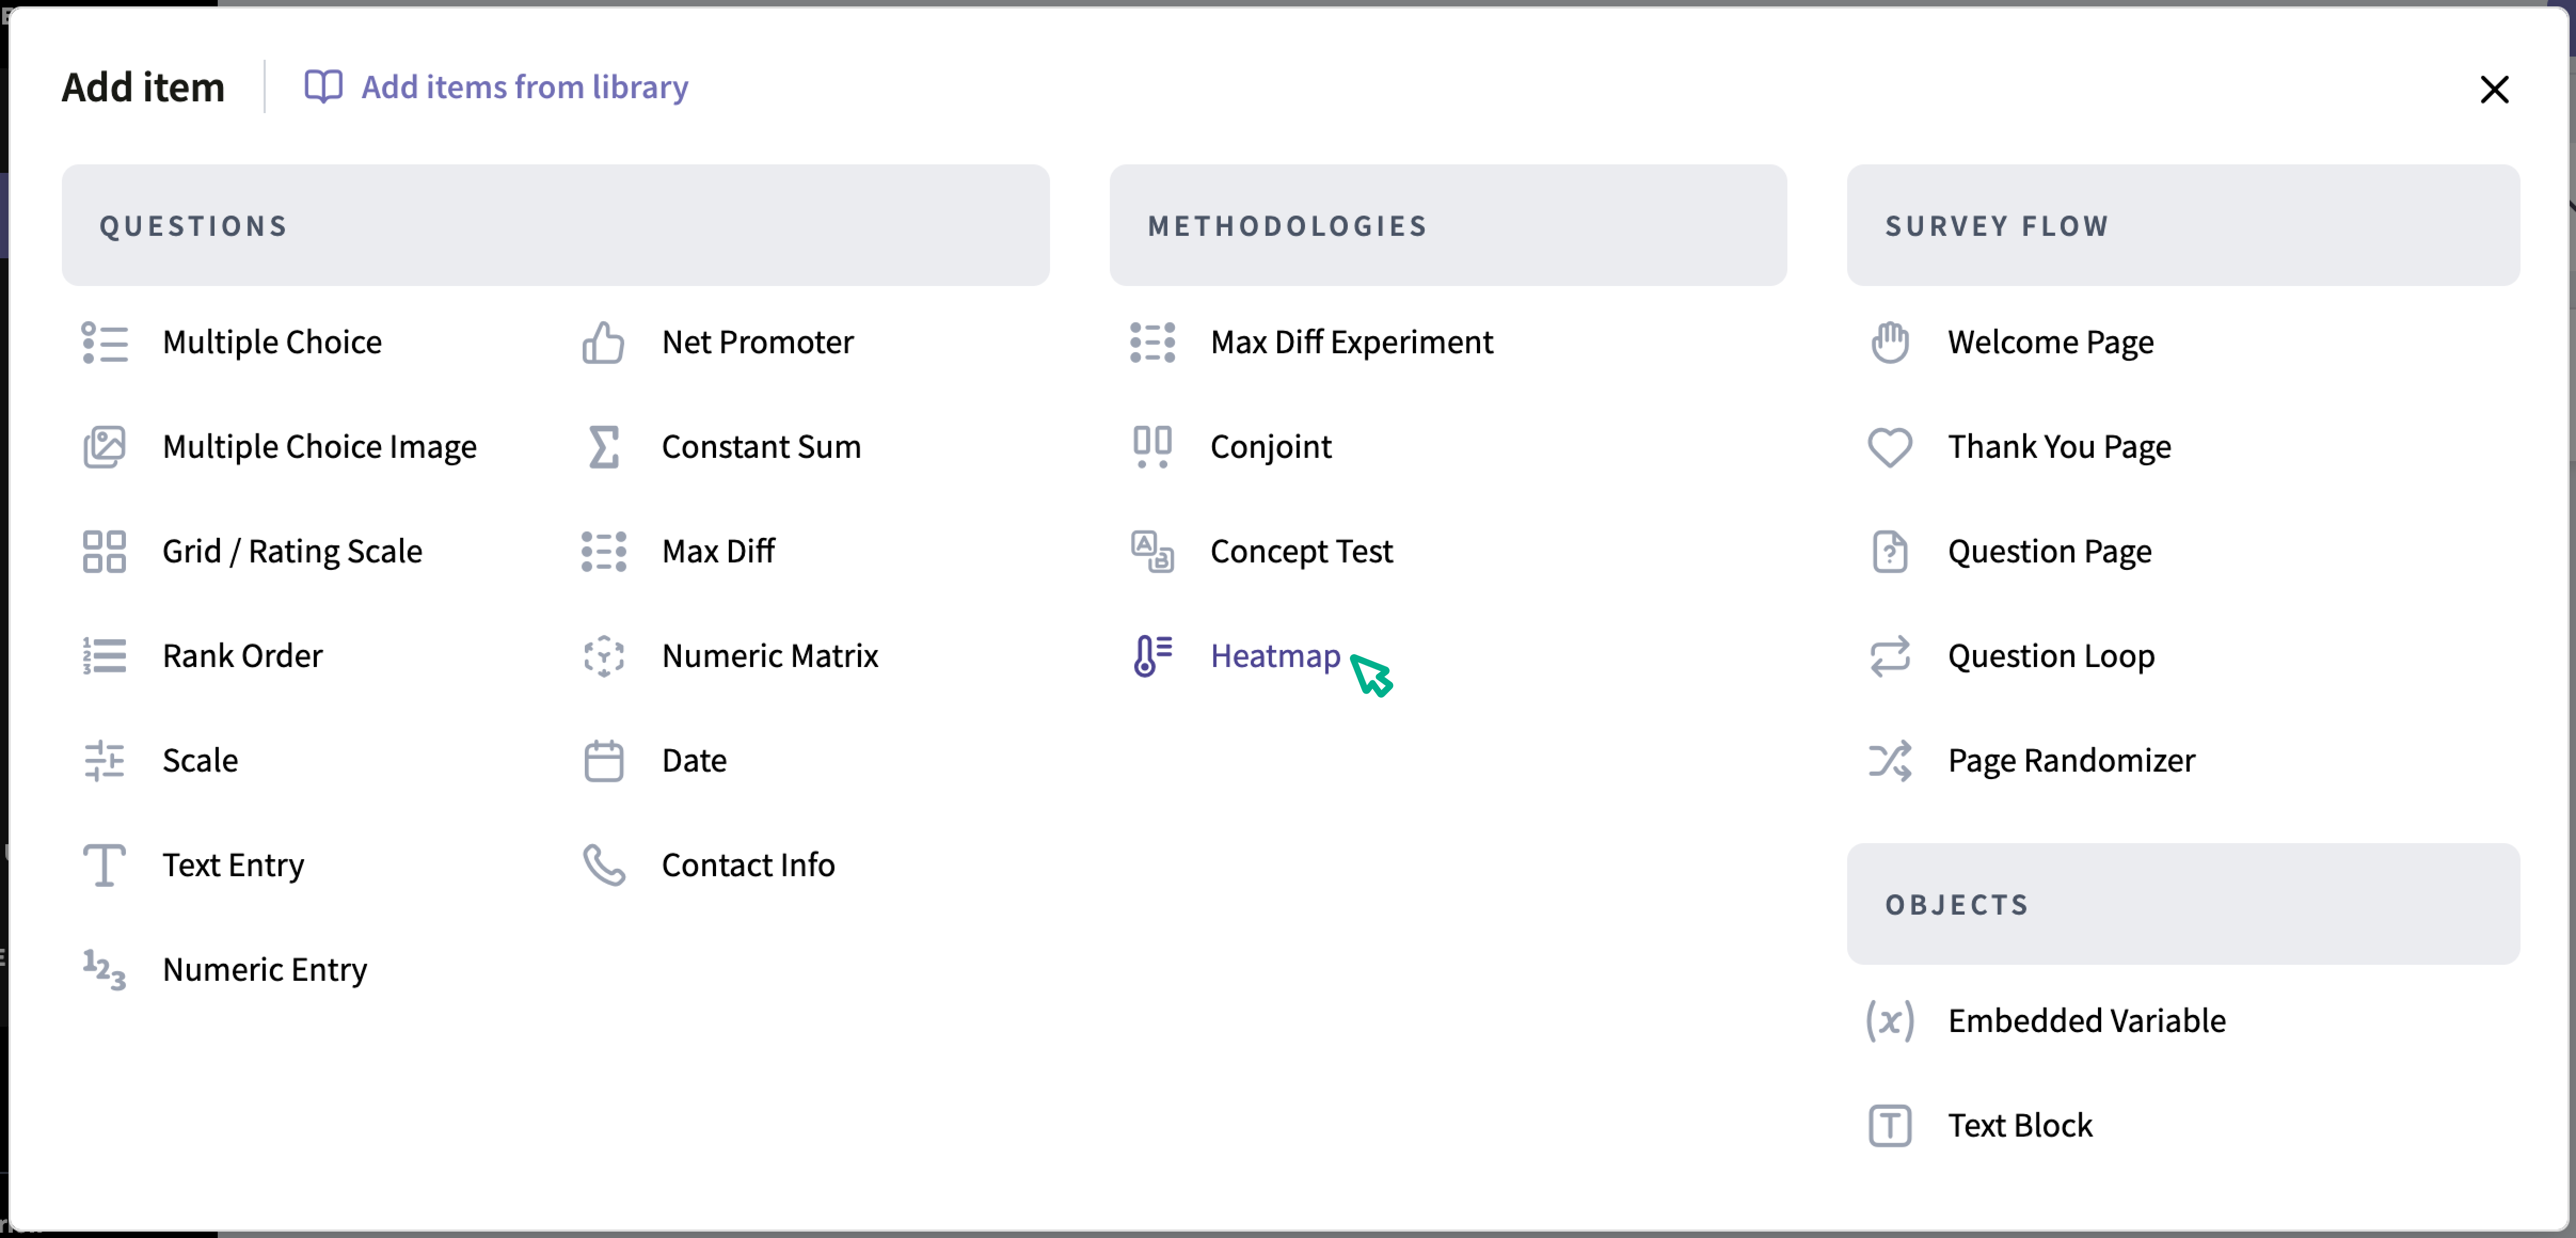
1. Add a title and description for the heatmap
The title won’t be shown to respondents; it’s just a way for you to identify the heatmap in the survey if you have multiple heatmaps. The description will be shown to respondents in the page prior to the heatmap.2. Upload an image, title the image, and add instructions
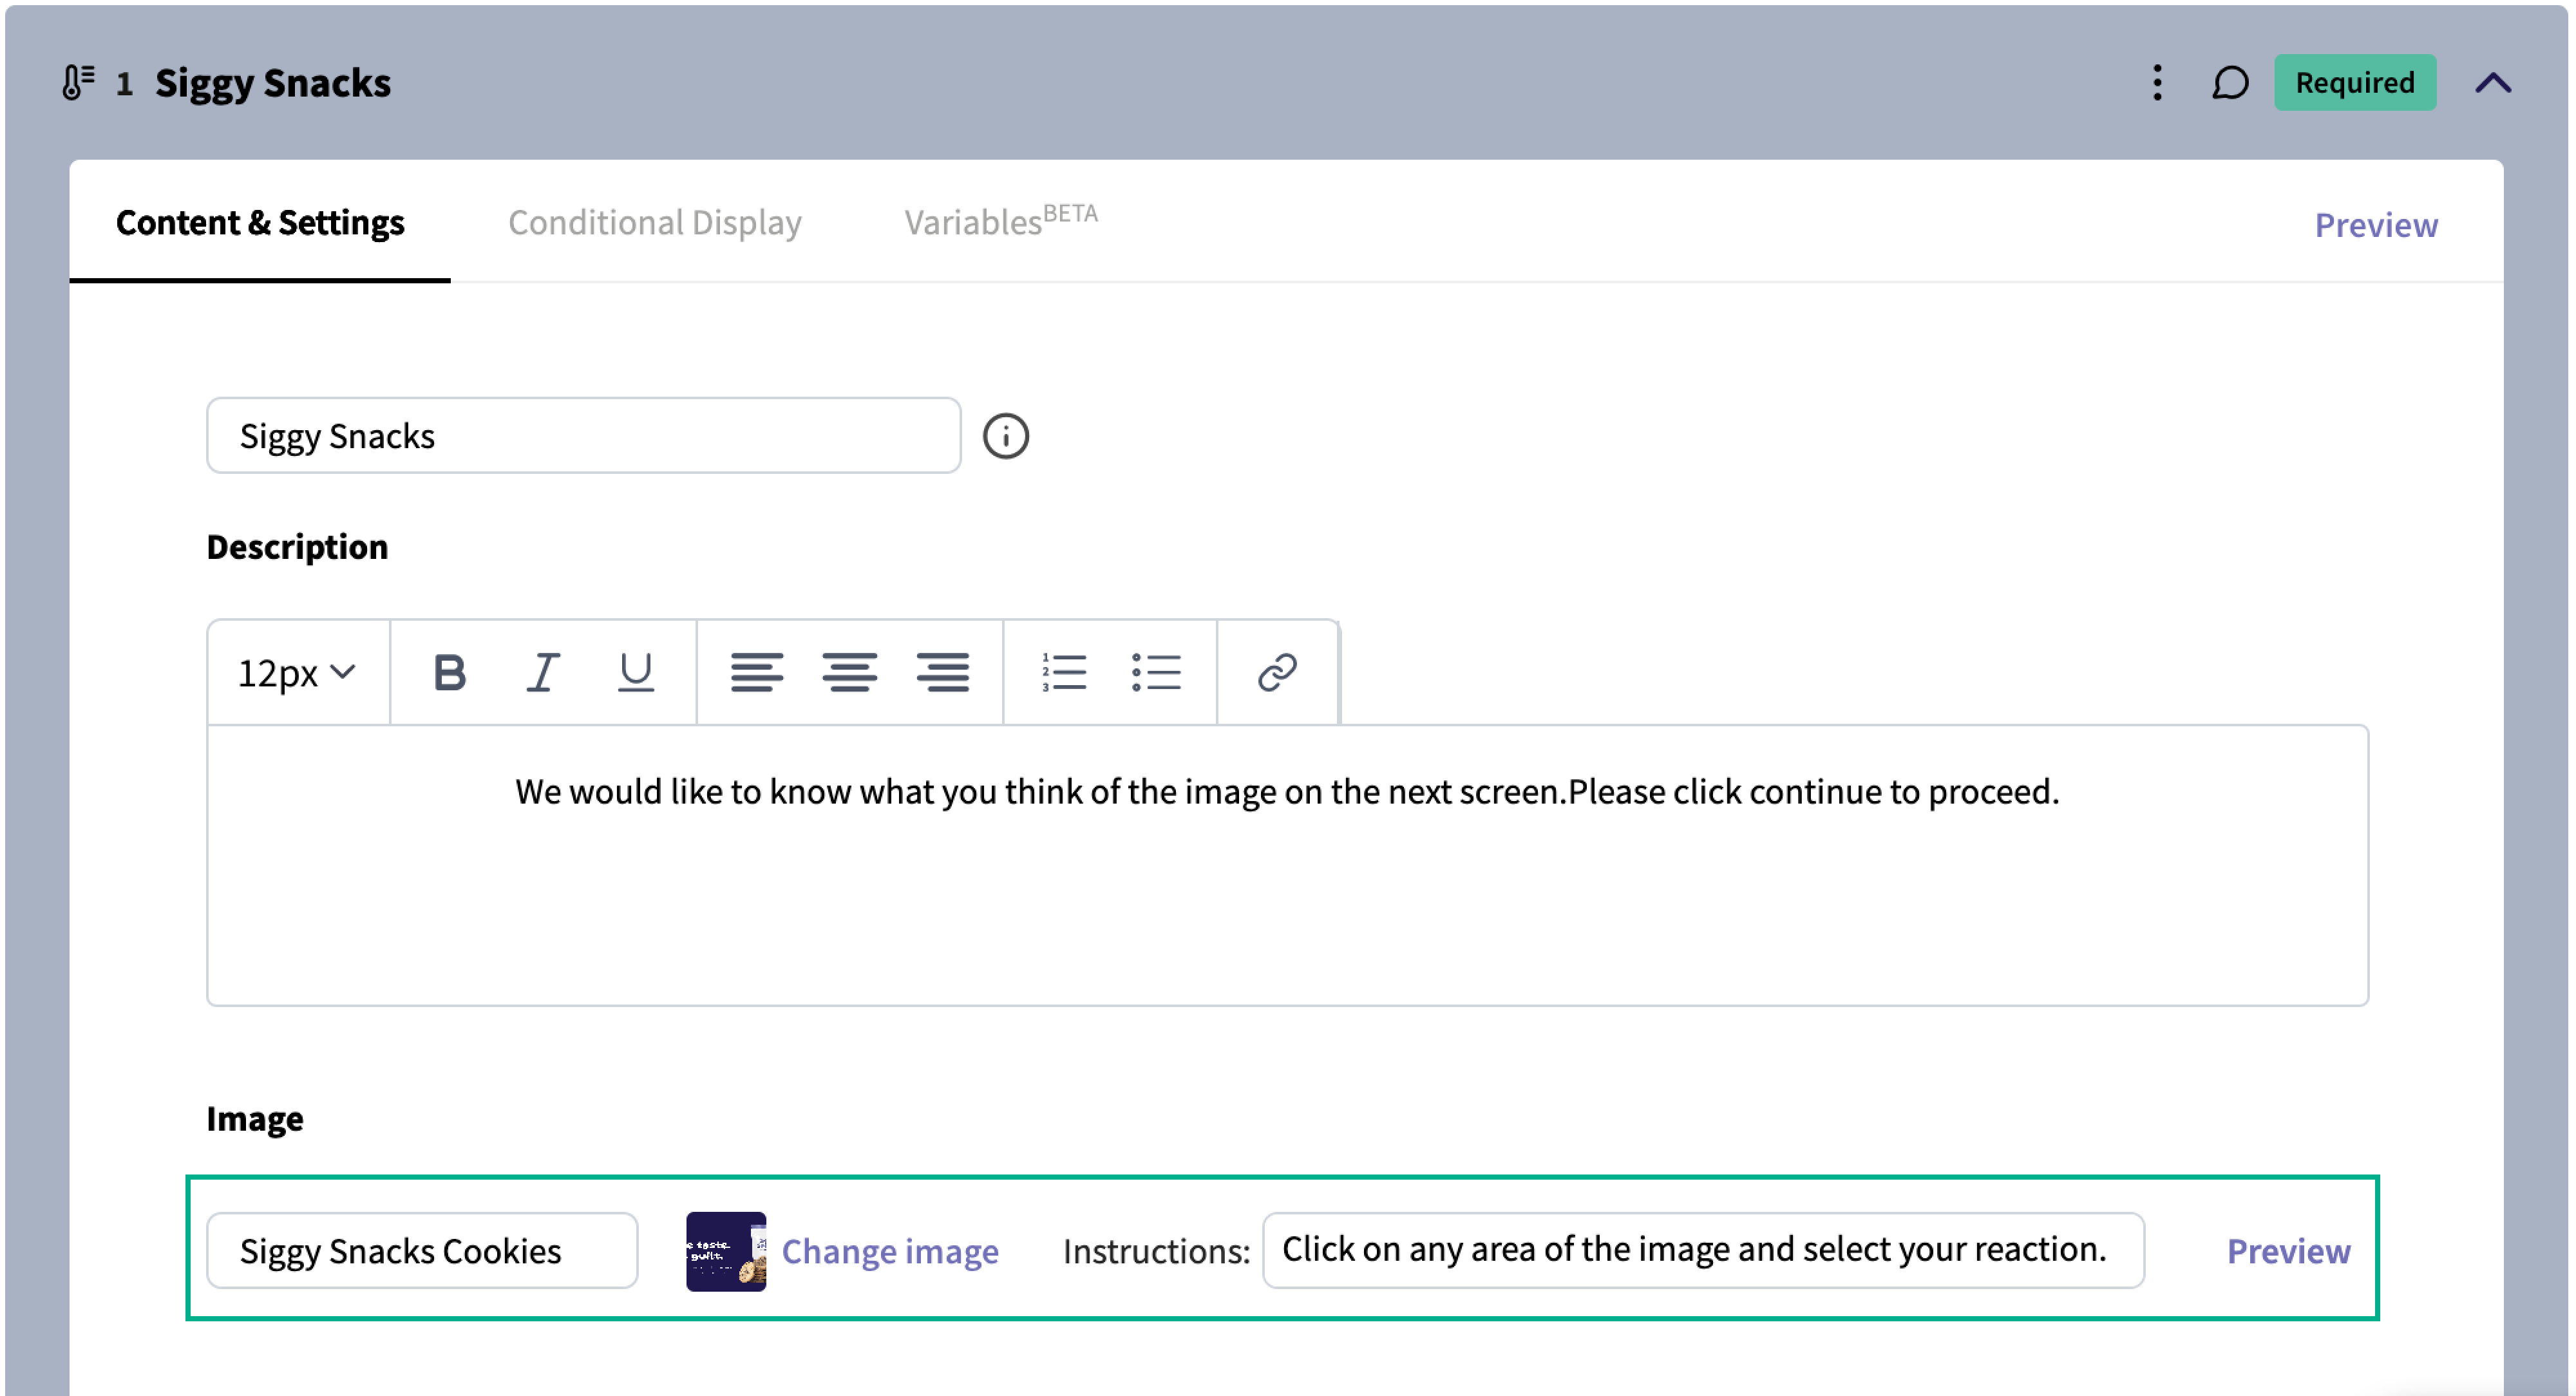

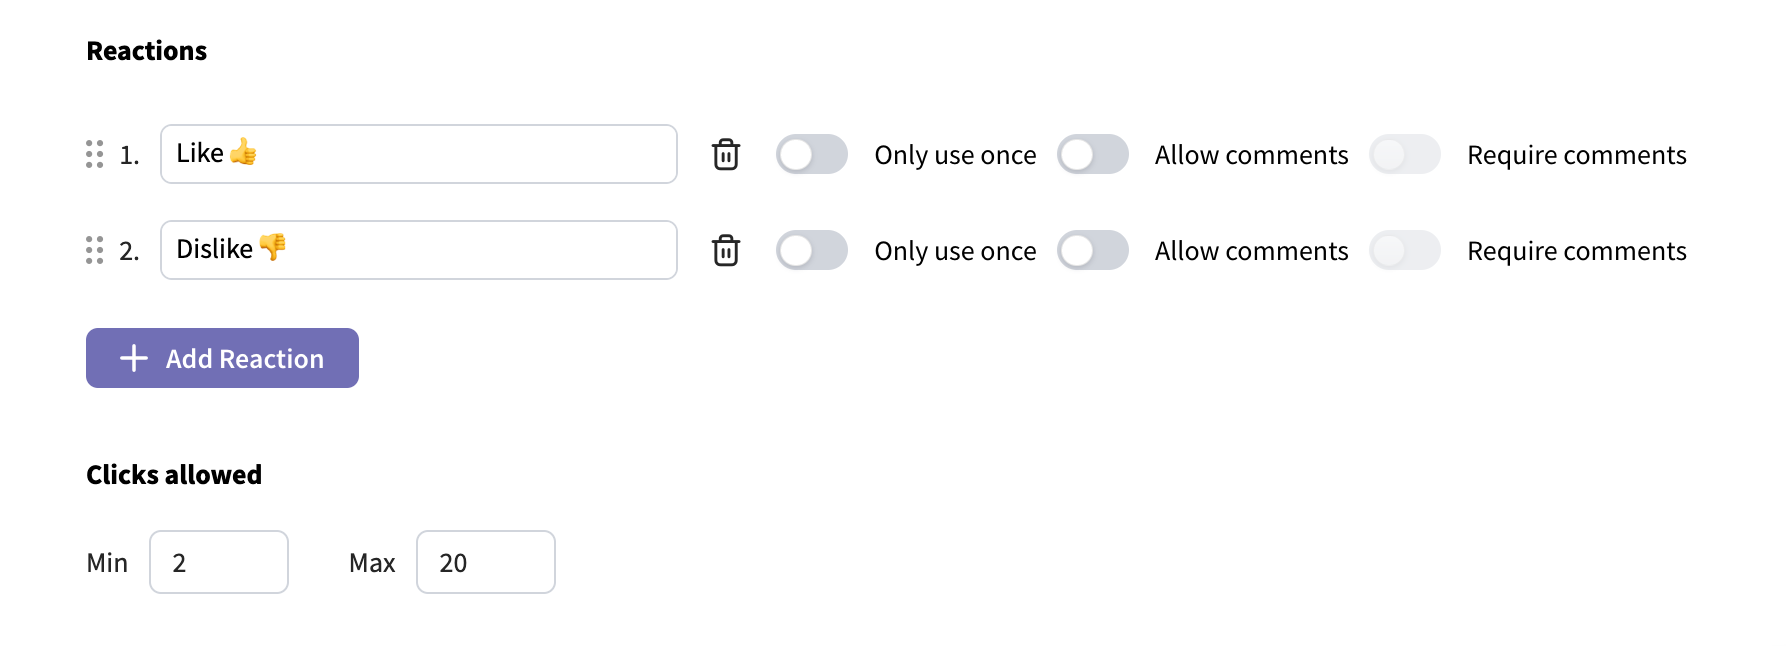
3. Add and configure reactions
Heatmaps Survey Example
You can use this link to test out a heatmap in a SightX survey, or watch the video below to see heatmaps in action. [video: Heatmaps Example]Analyzing a Heatmap Experiment
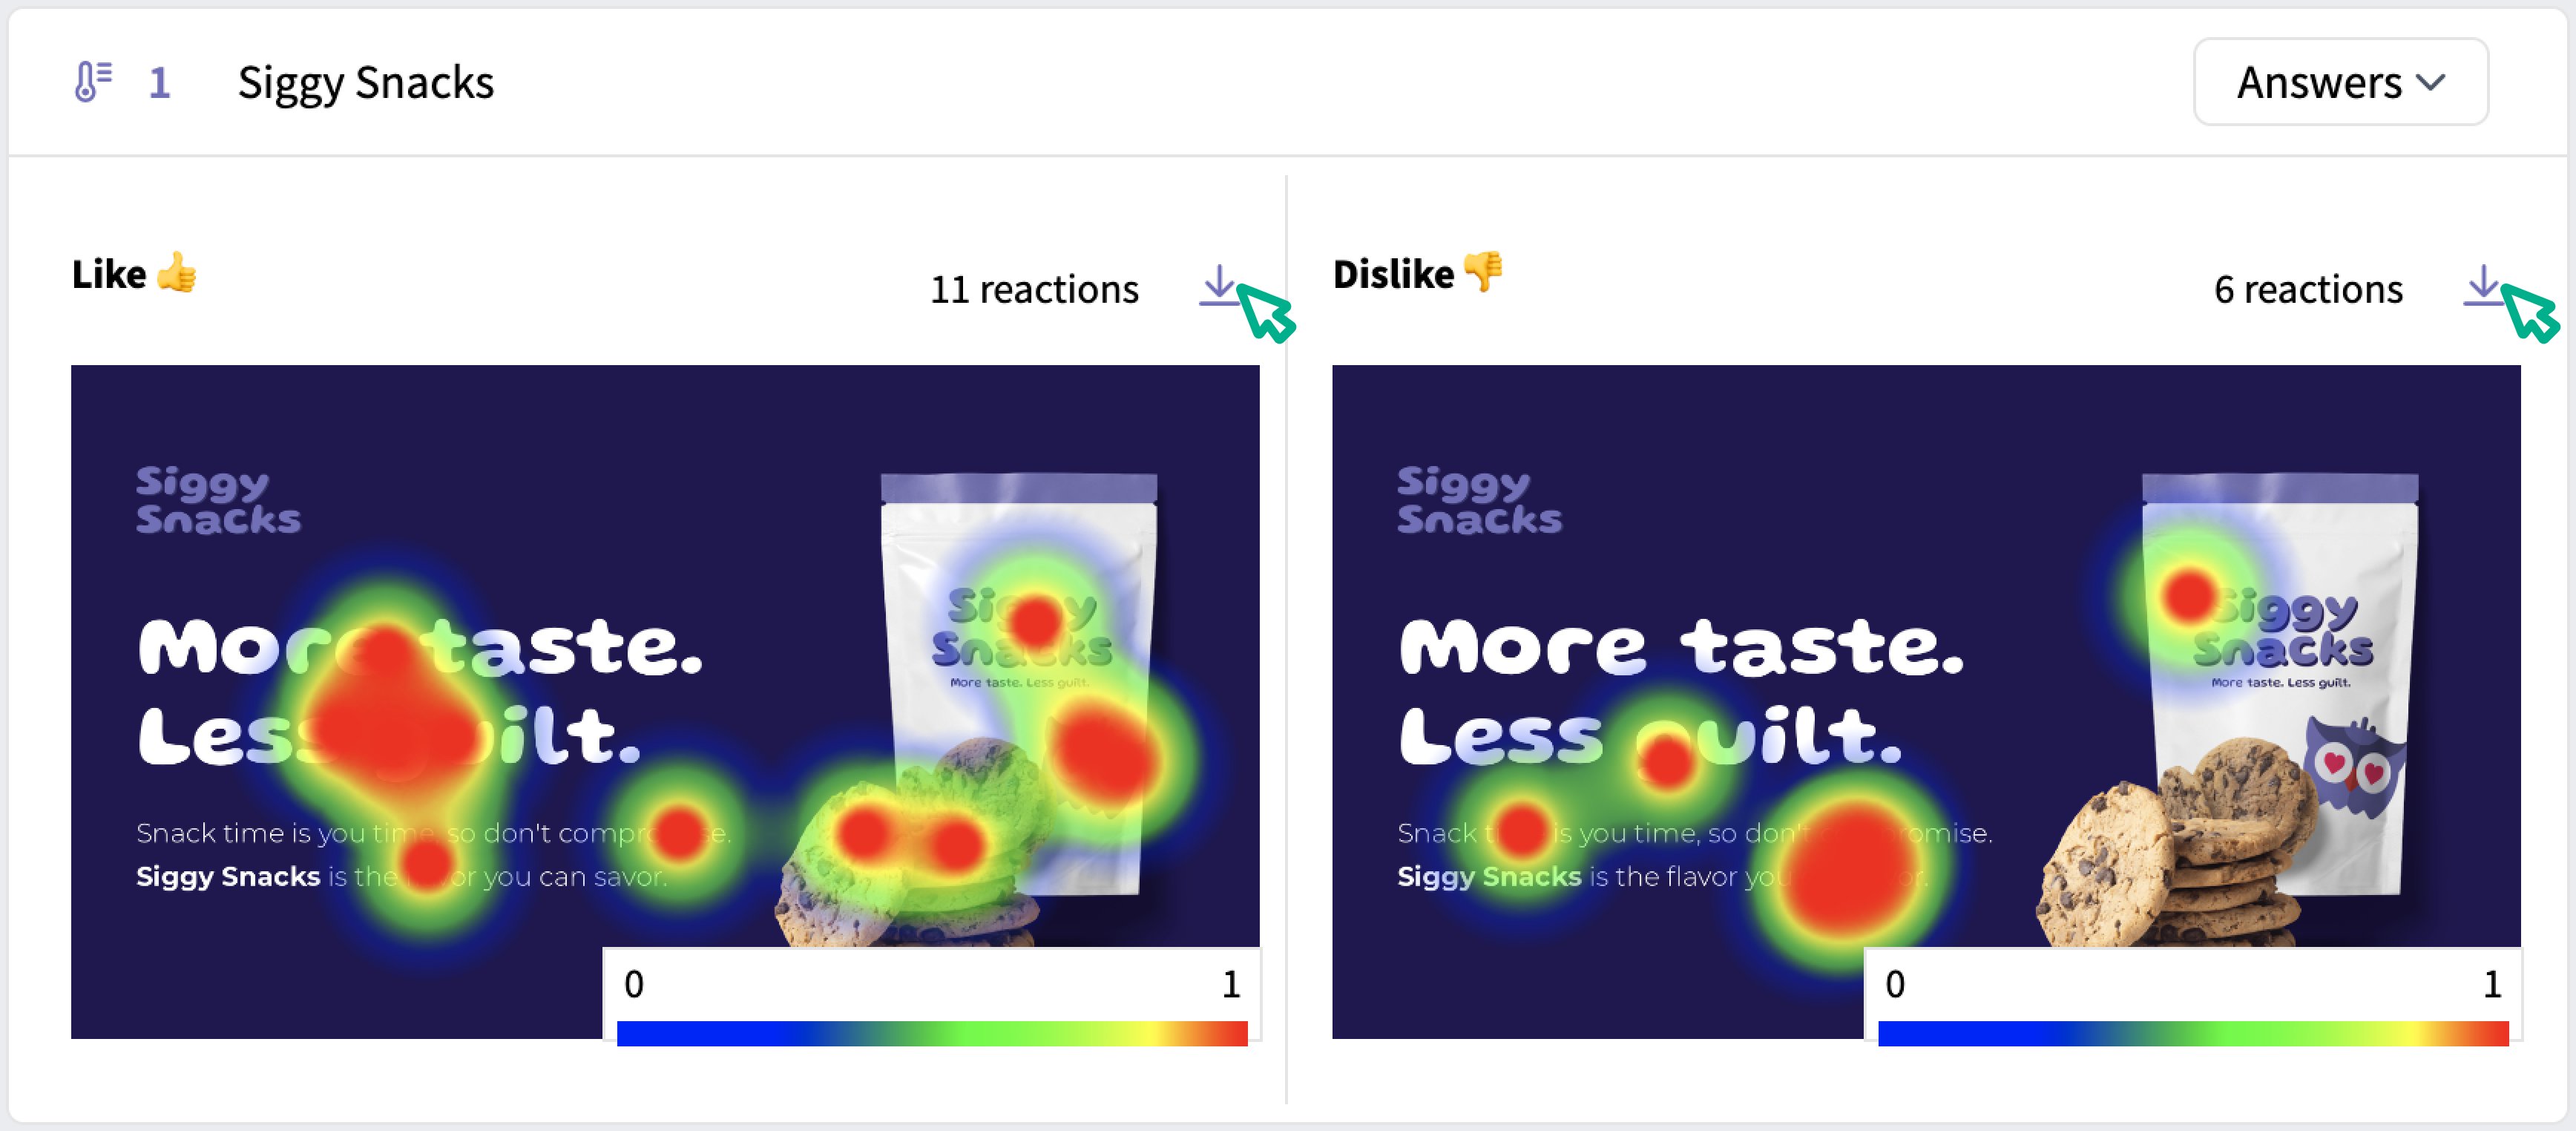
The output of a heatmap experiment shows a heatmap image for each reaction. You can see the number of clicks for each reaction, and a map of where those clicks occurred on the image.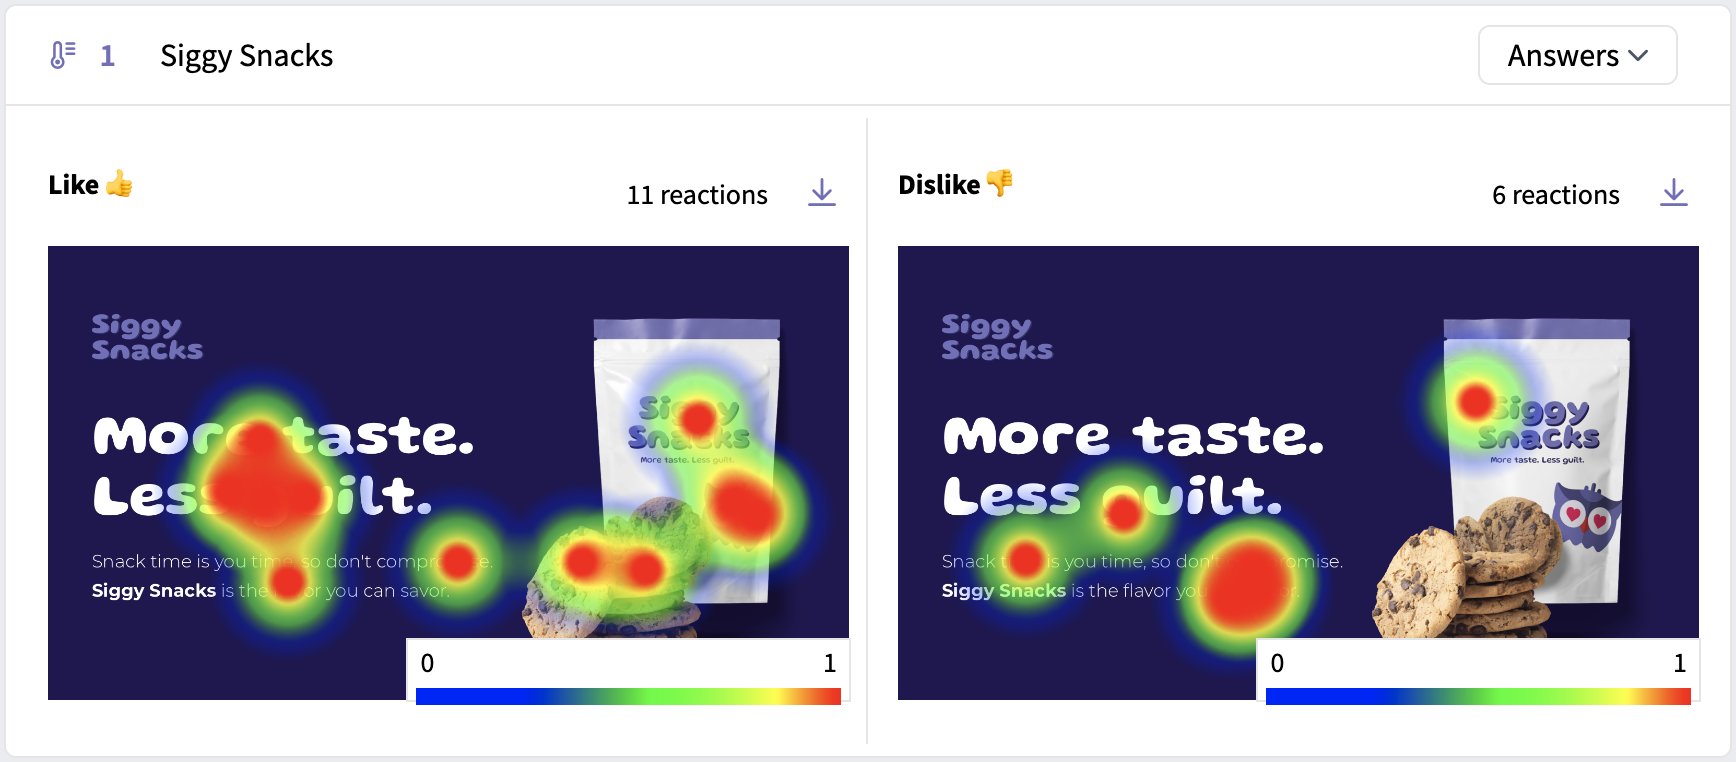
Exporting Results from a Heatmap Experiment
You can export the heatmap images as PNG files by clicking the export button in the top right corner of the image for each reaction: