Creating a New Crosstab
Once you’ve collected your survey responses, navigate to the Analyze section of your project and then to the “Crosstabs” page in the left menu. Click the ”+ New table” button in the upper right corner of the page to create a new table.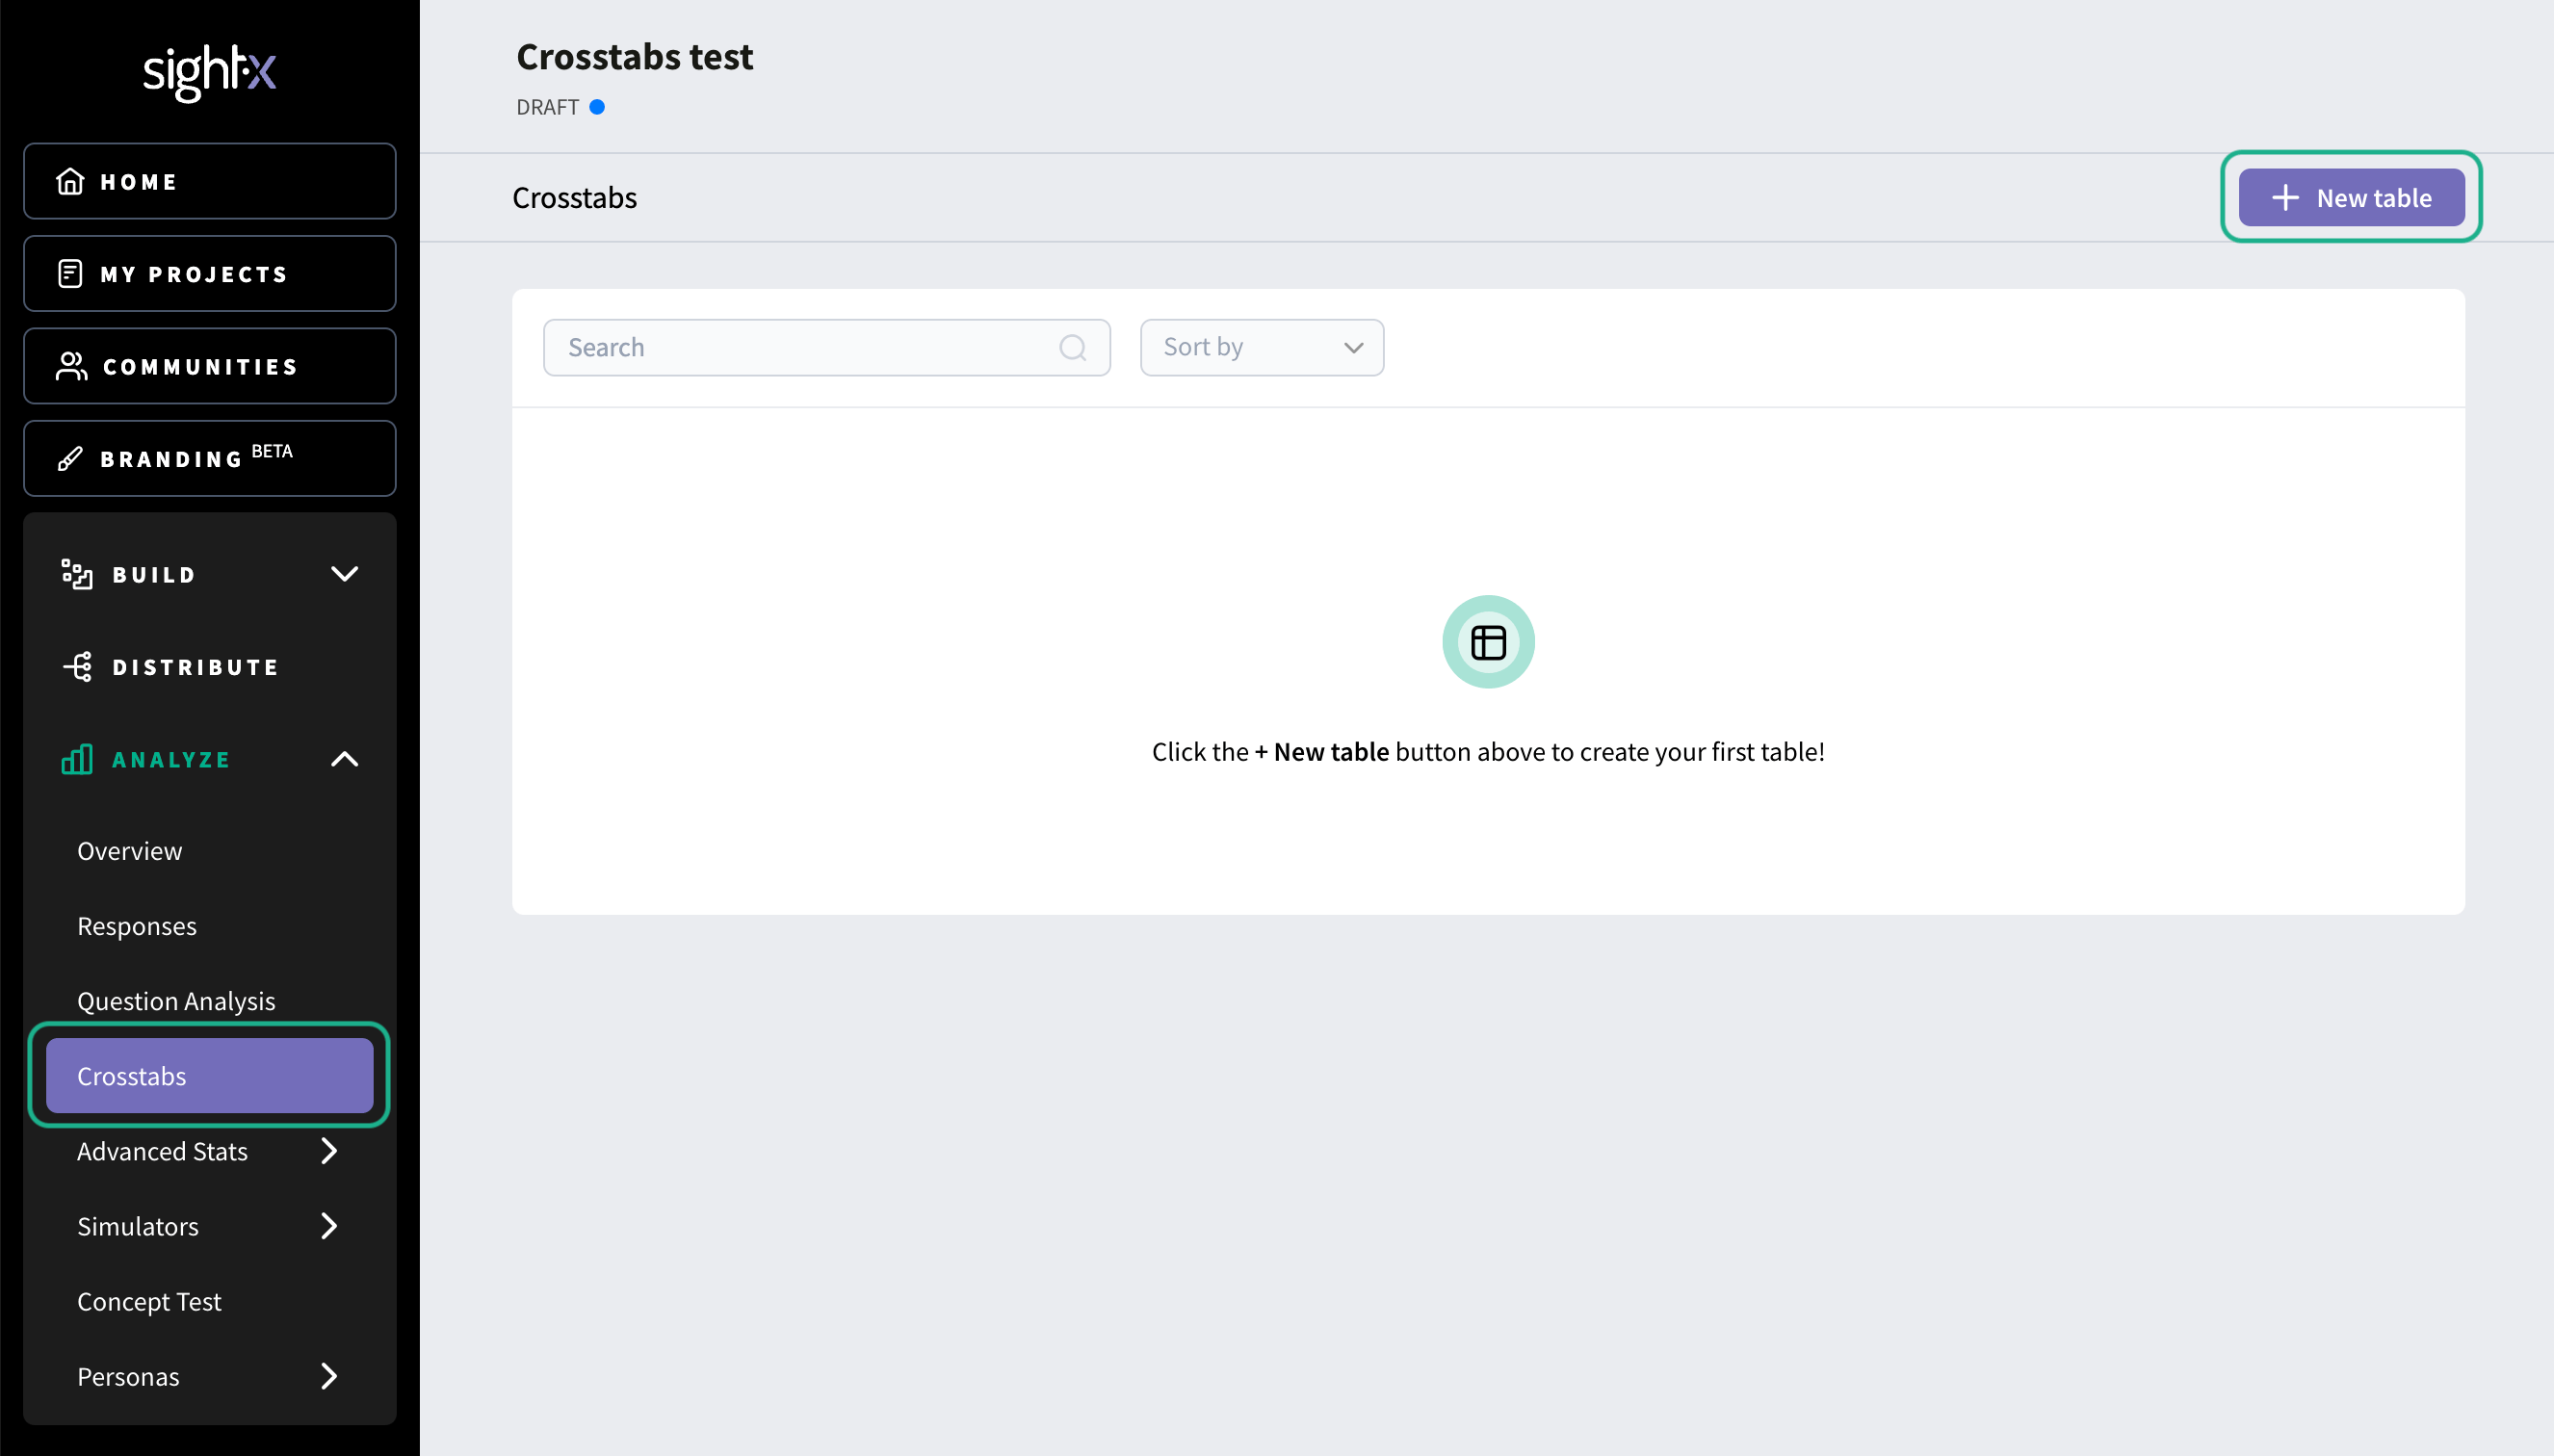
Adding Columns and Rows
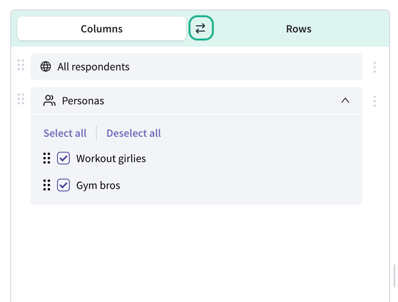
Add survey elements from the data bank to the columns and rows by selecting the checkbox next to the data bank item. Switch from “columns” to “rows” by clicking the header.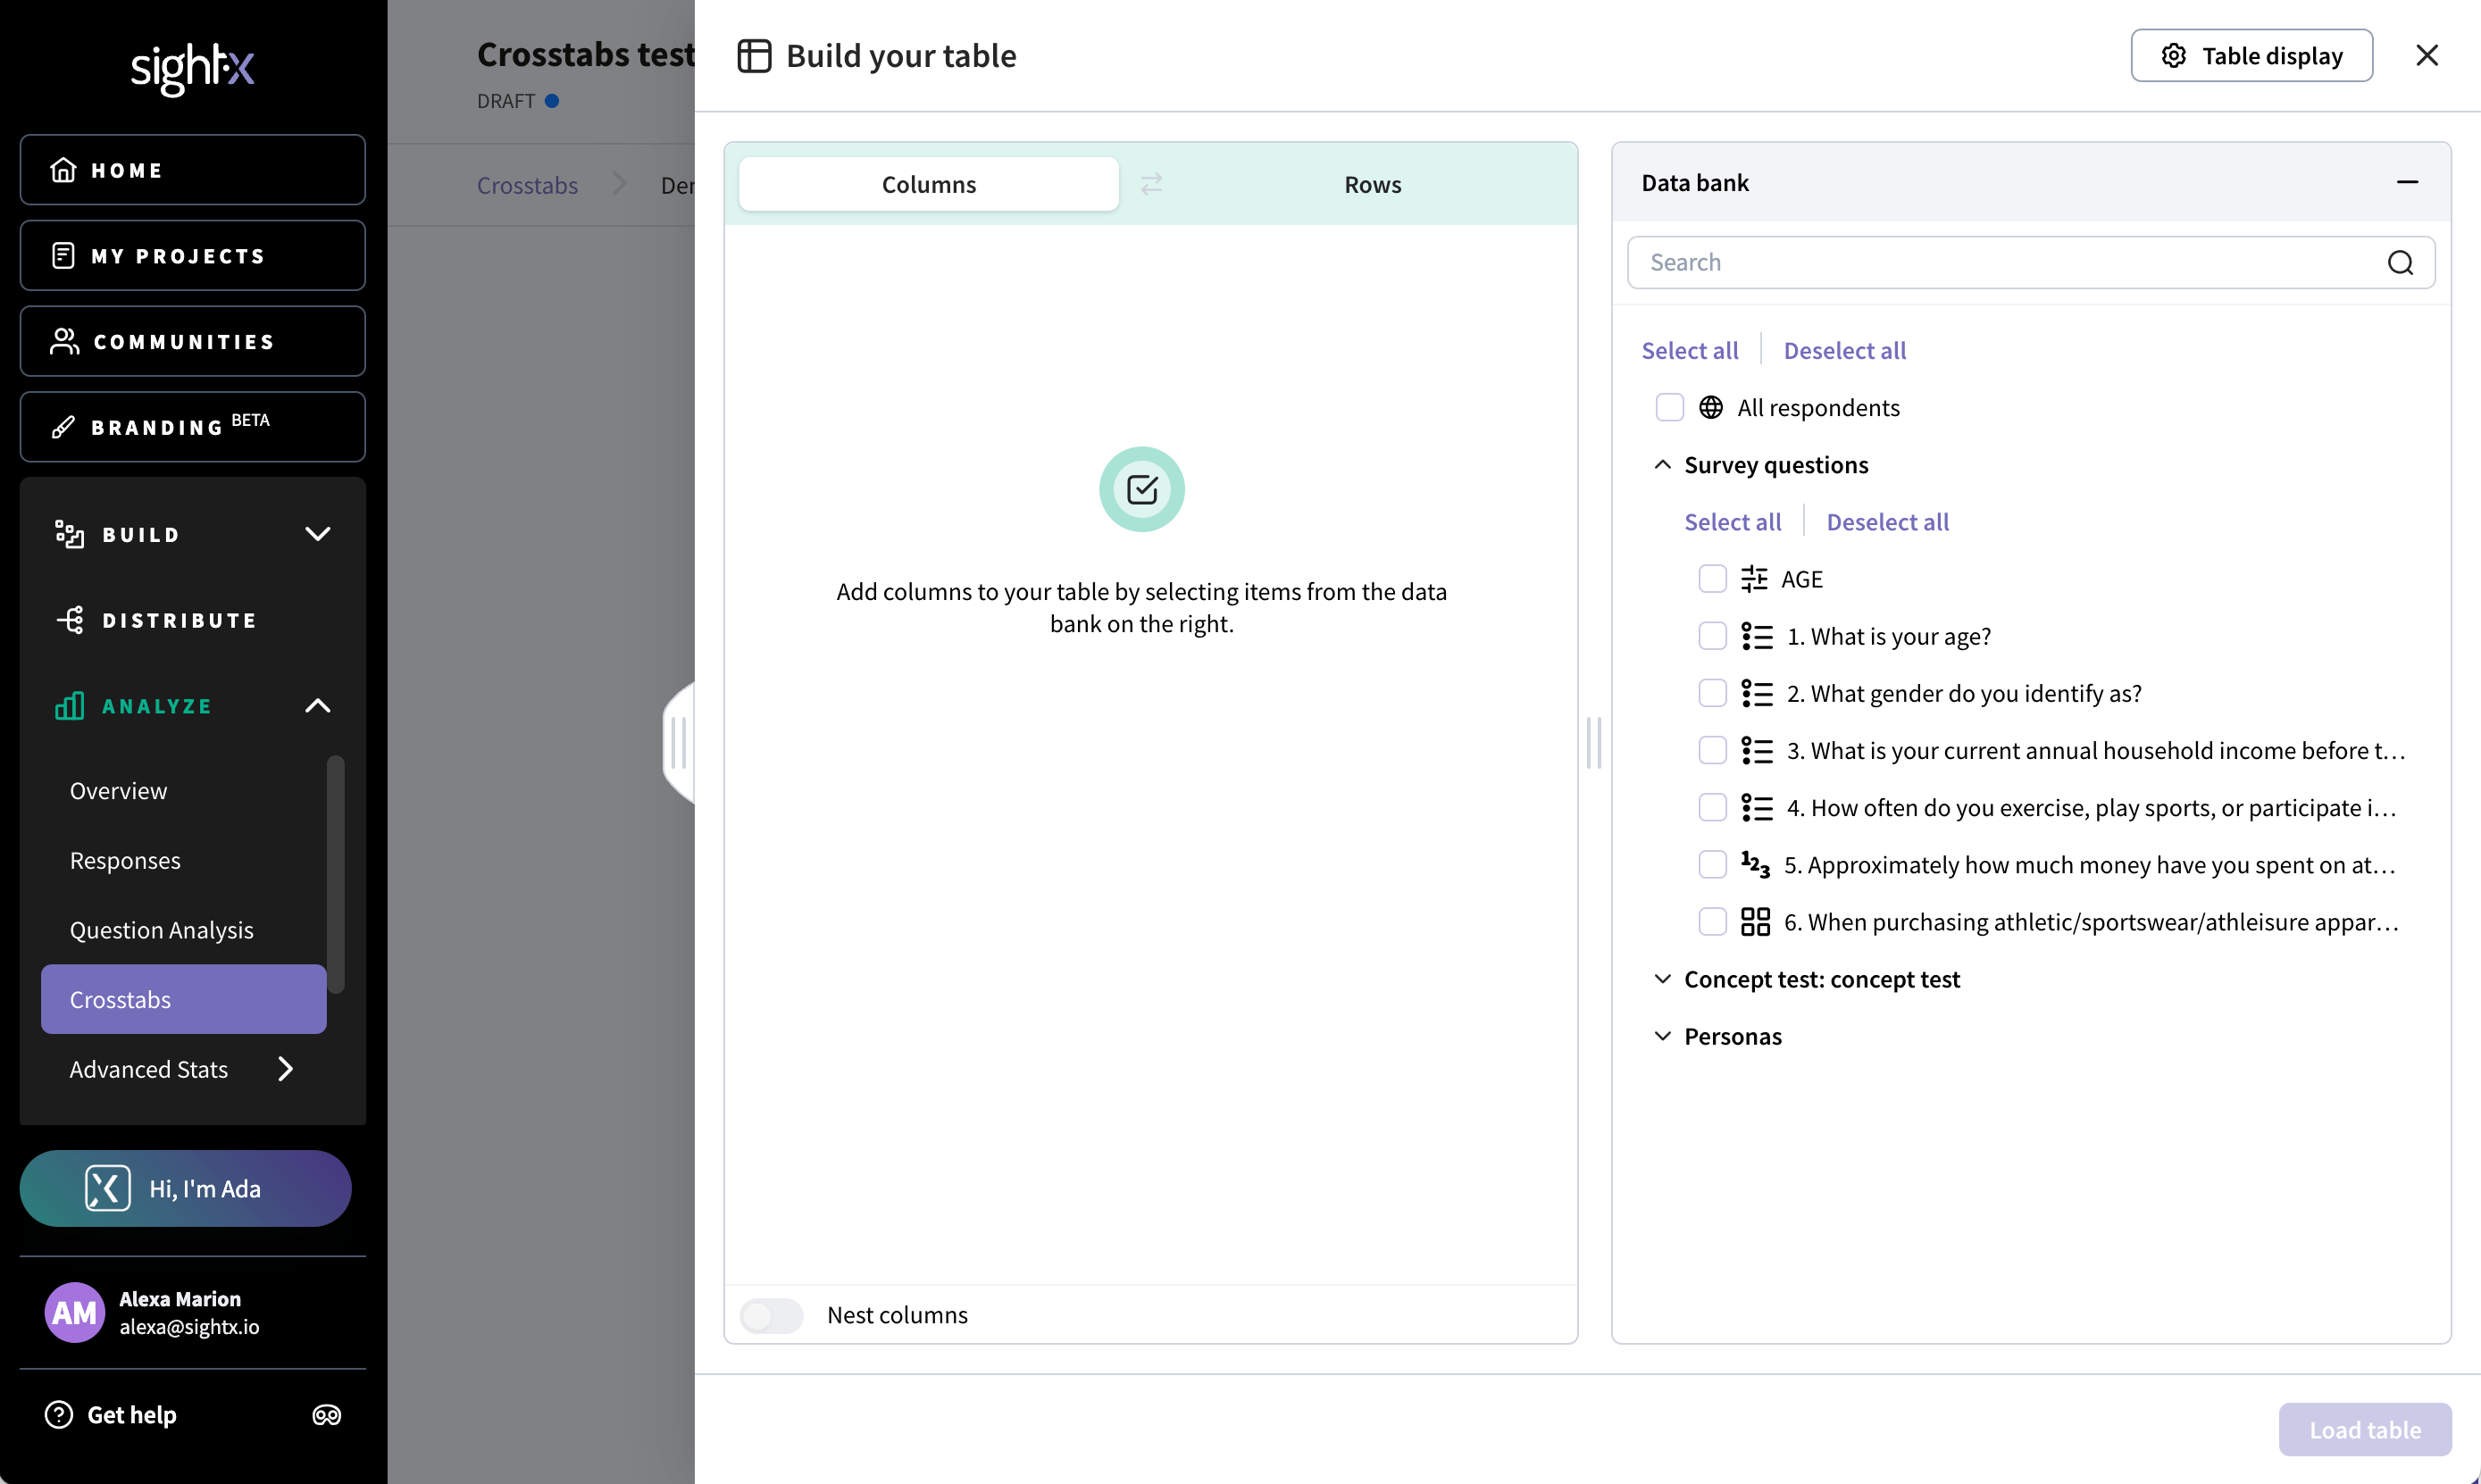
Configuring Columns and Rows
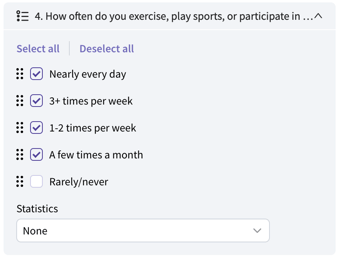
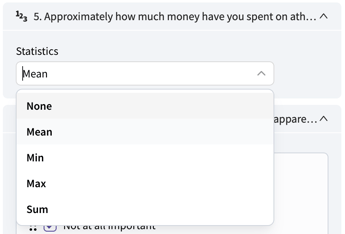
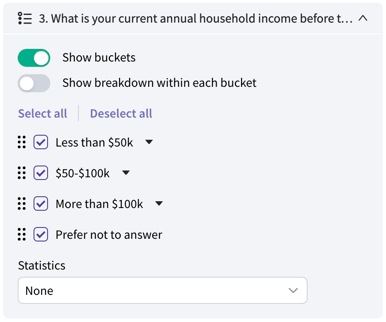
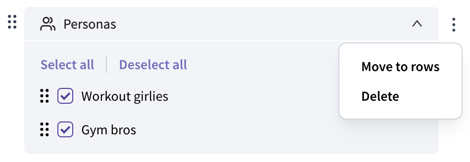
Once you’ve added items to the columns and rows, you have several configuration options: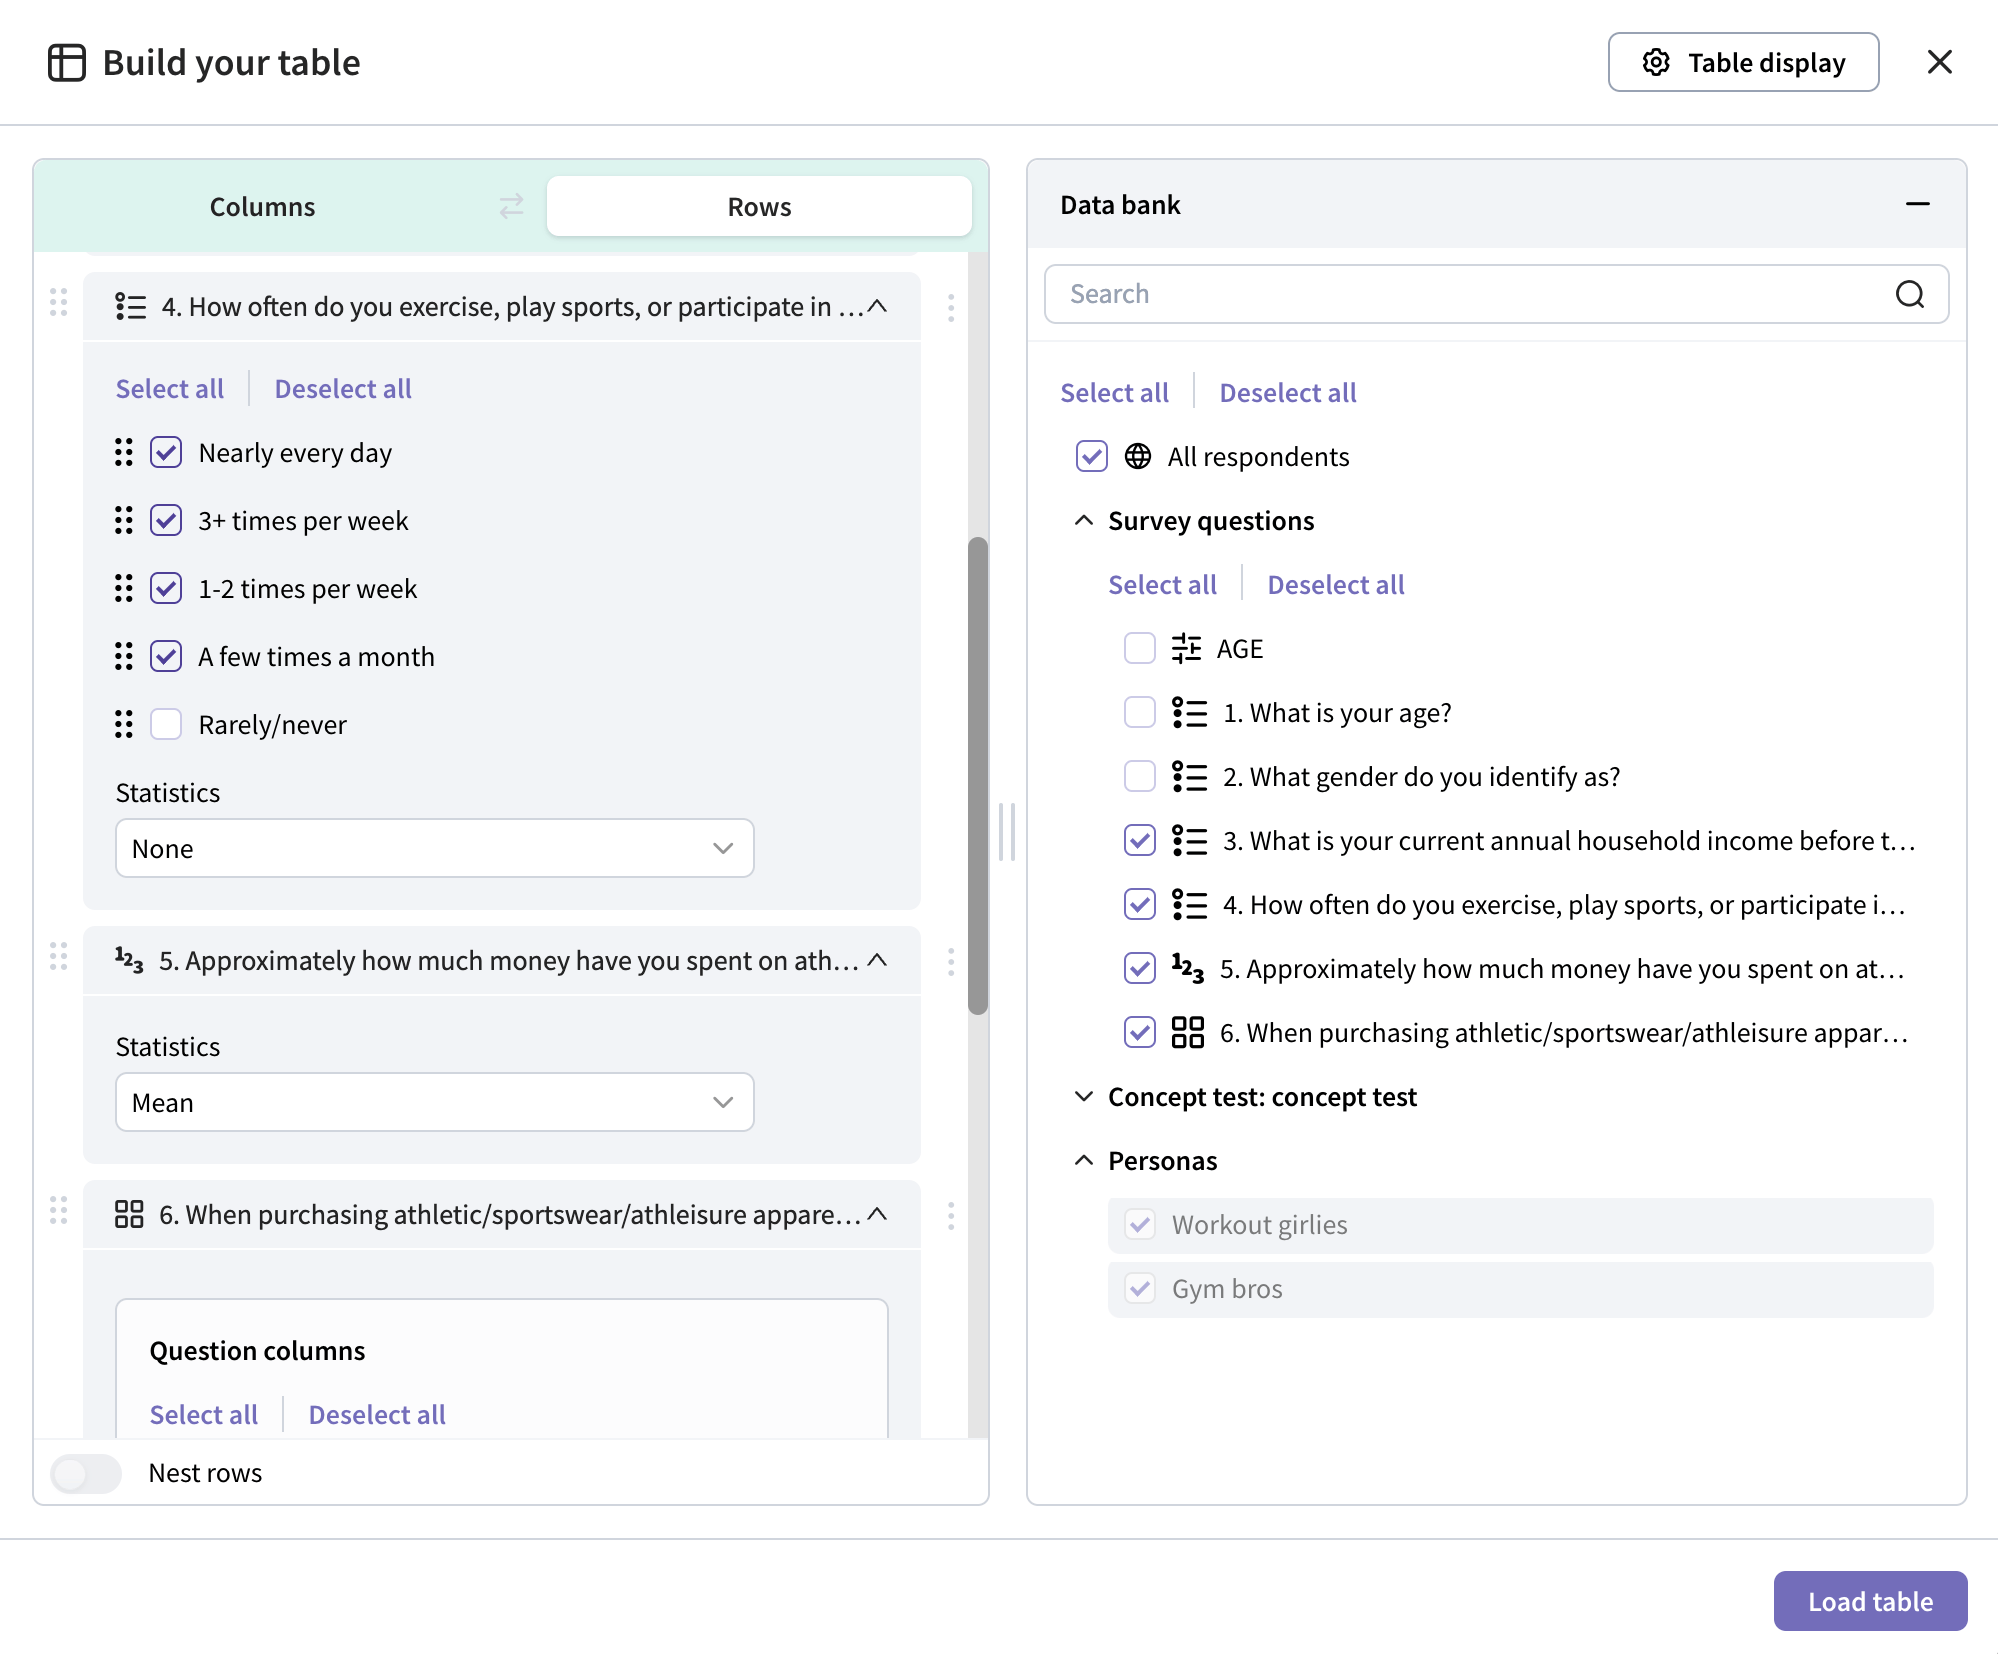
Calculations and Table Display Settings
Click on the “Table display” button in the upper right corner of the window to edit table calculation settings, add subtotals, and more.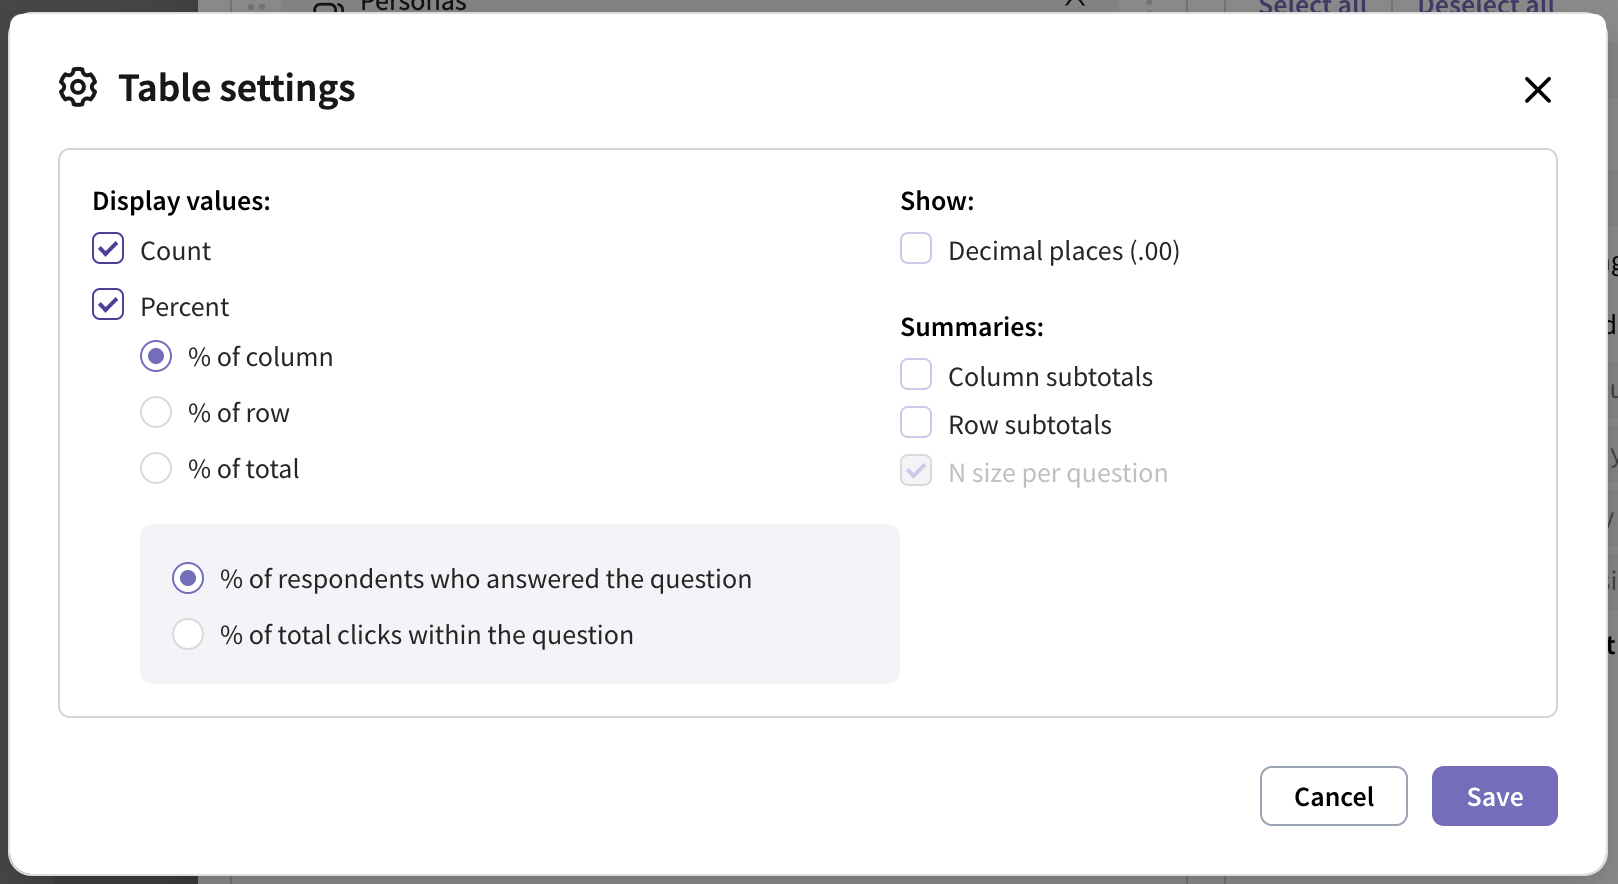
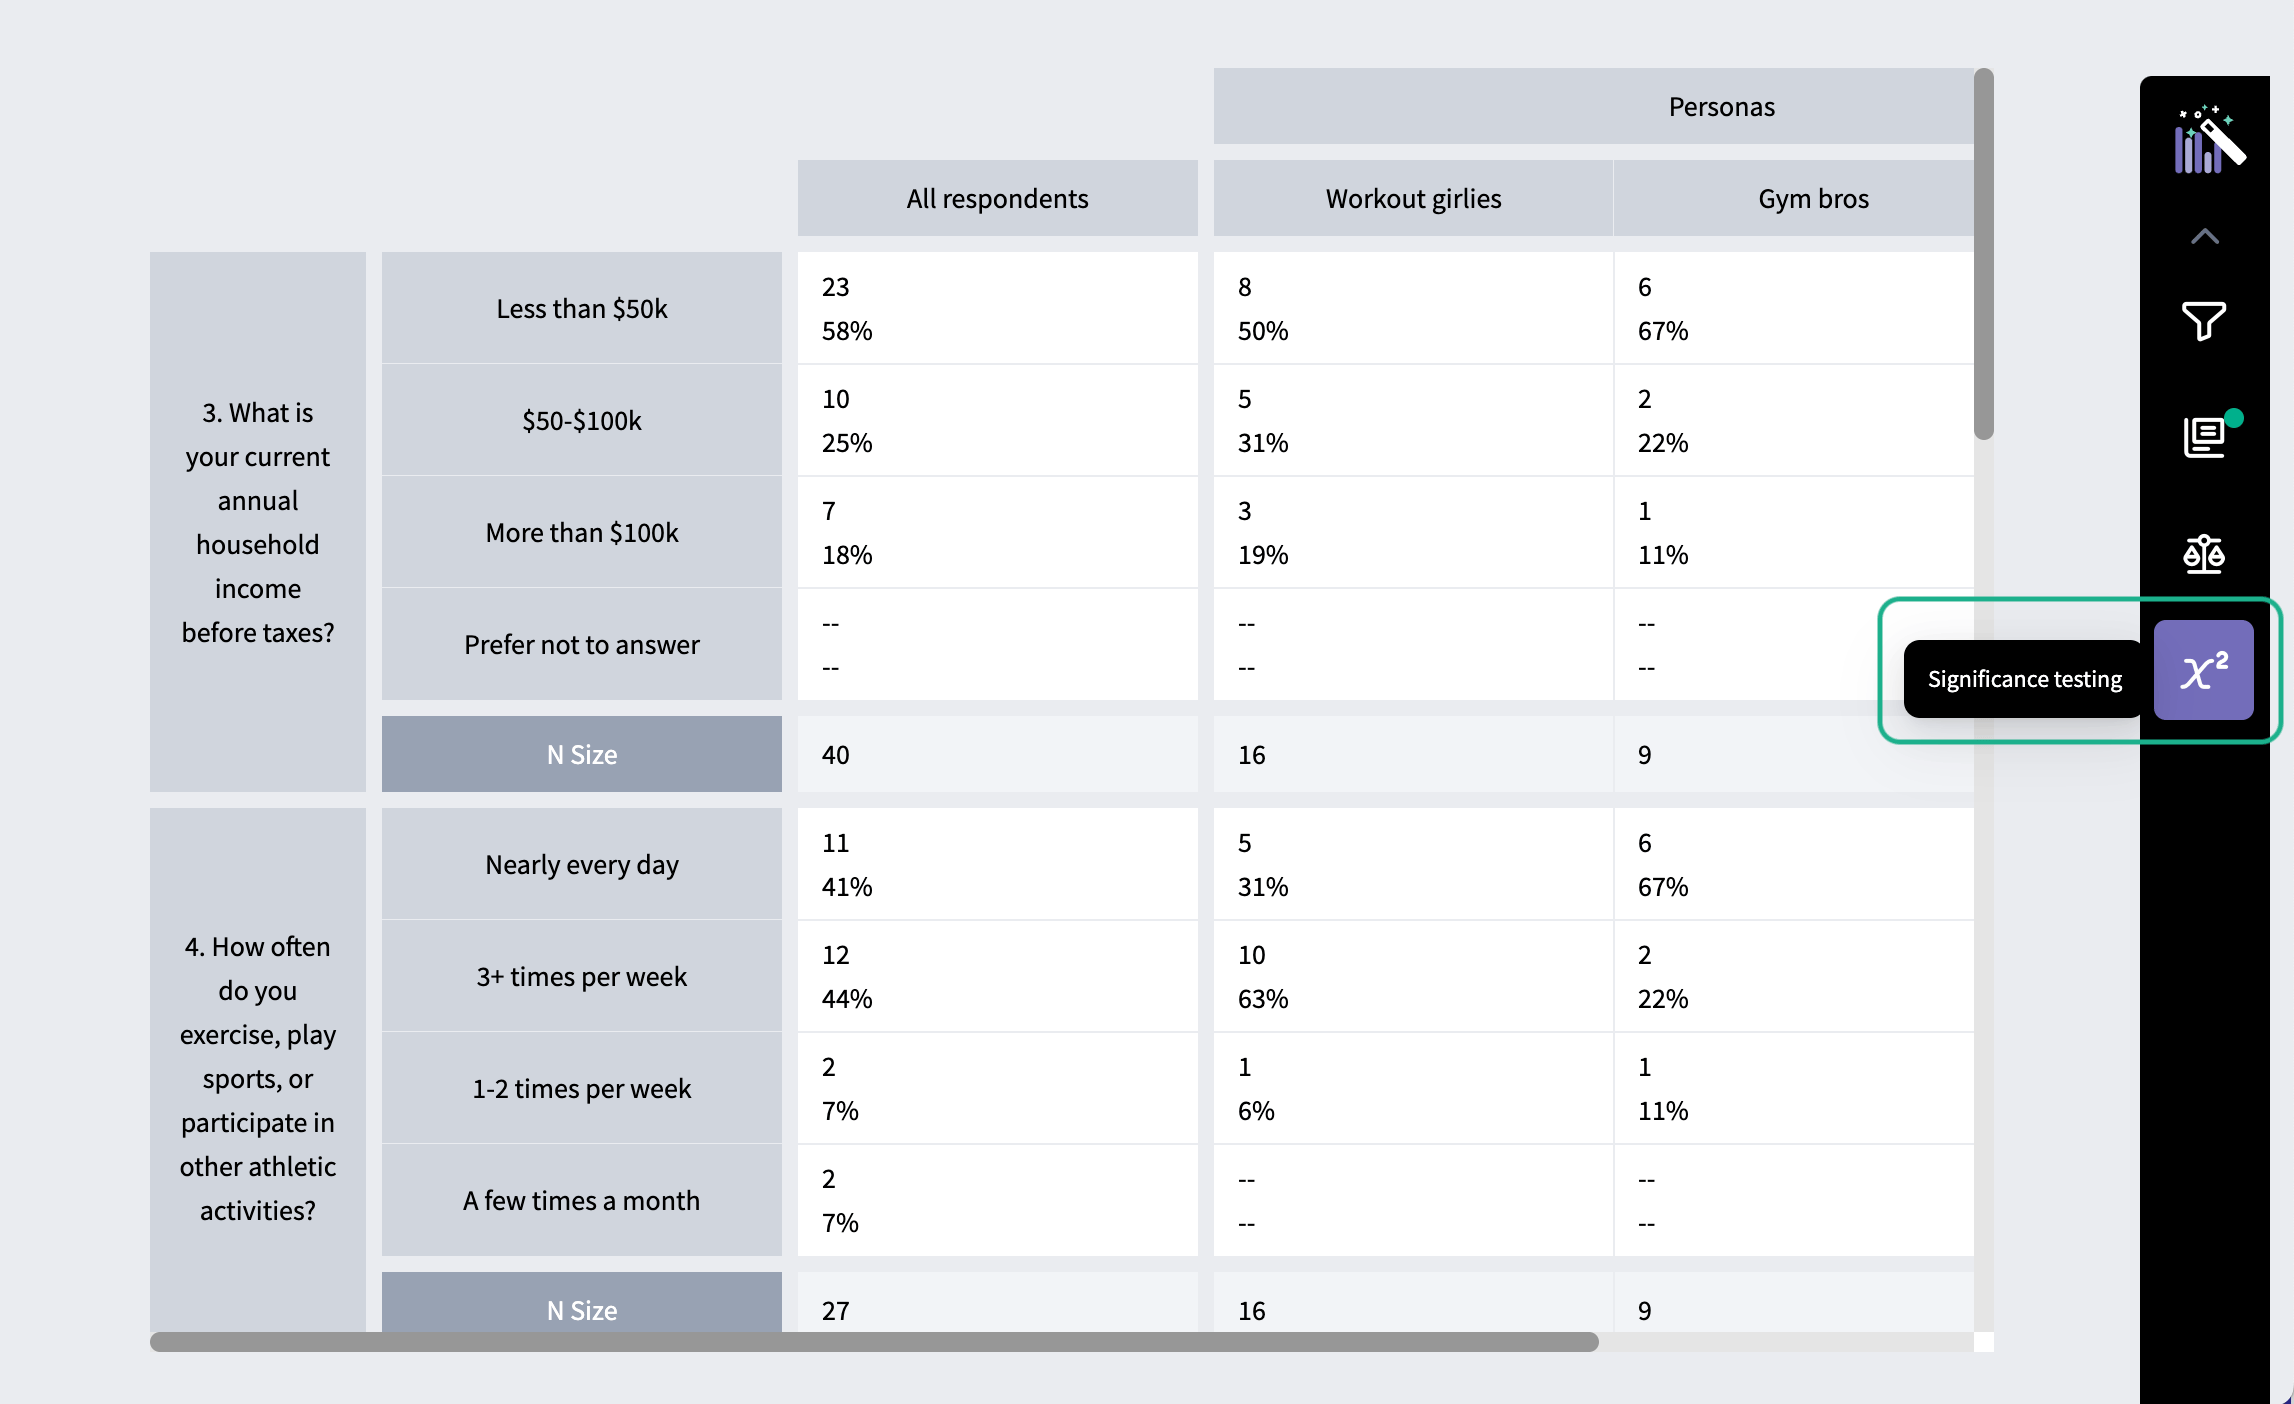
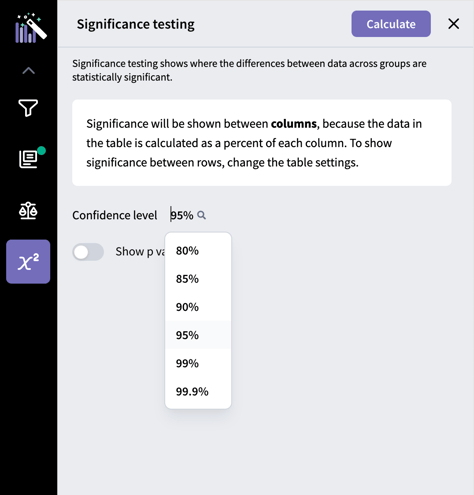
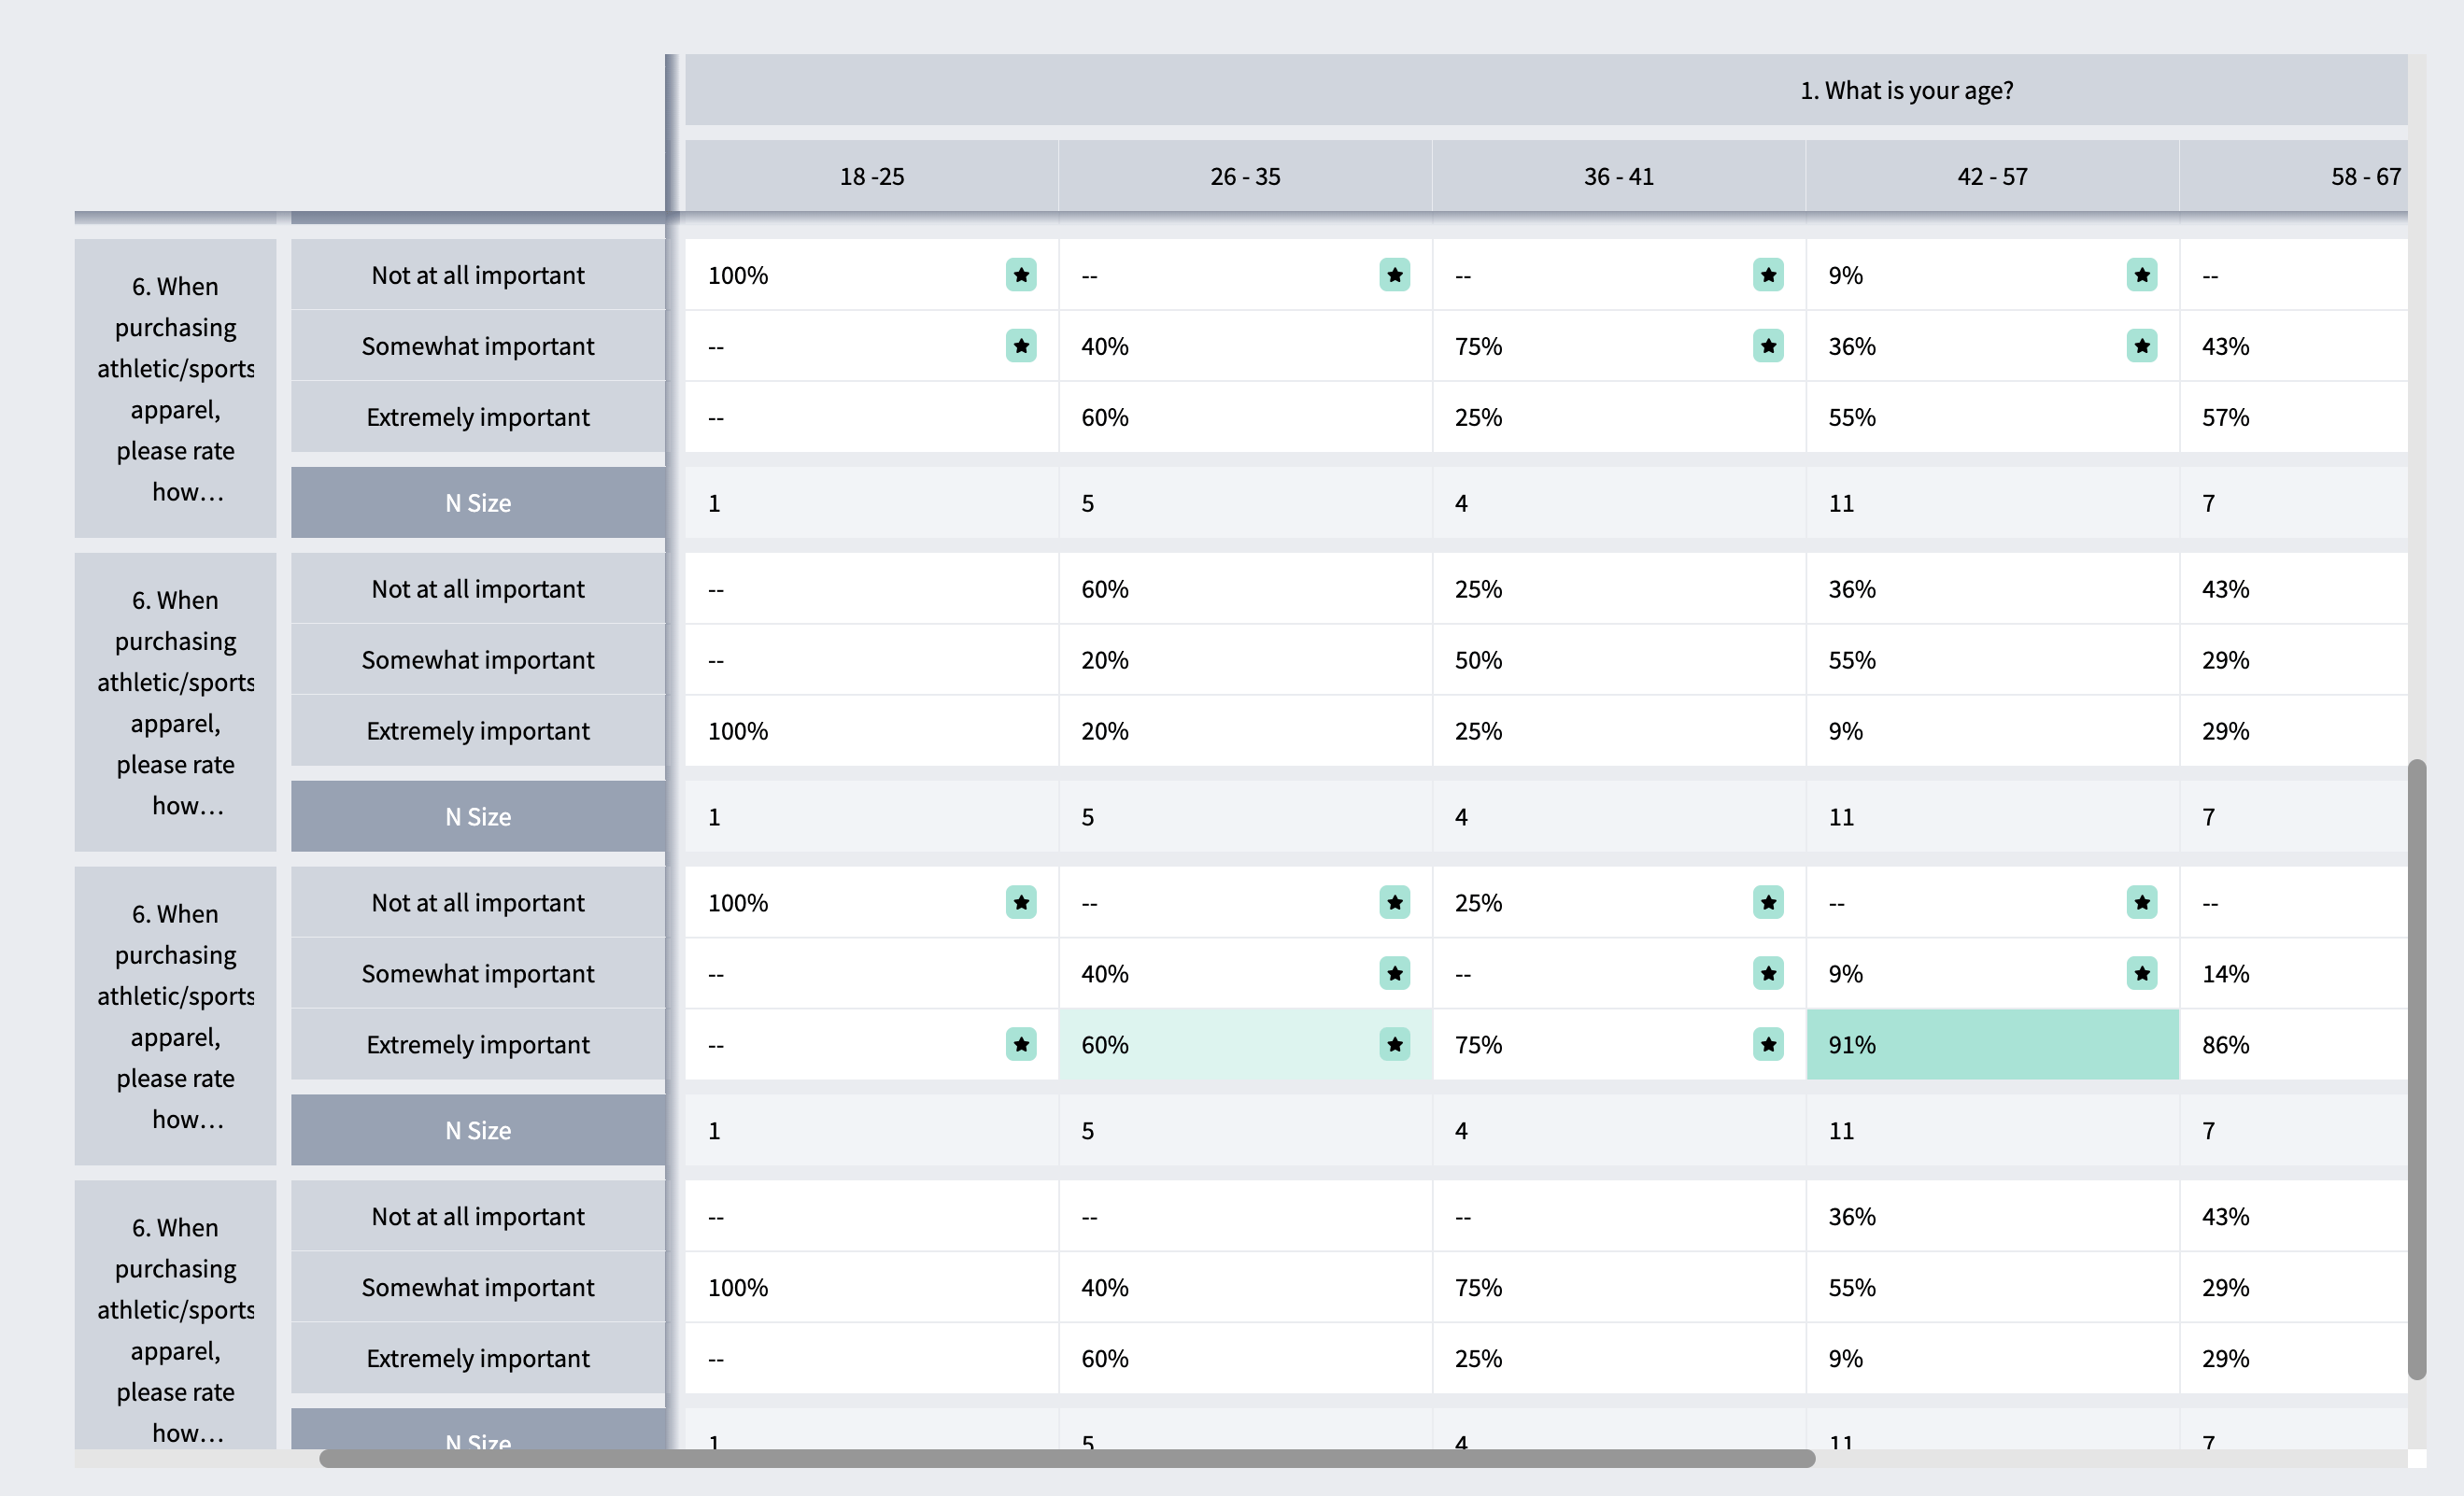
Apply Stat Testing
To show significant differences between data in your table, turn on significance testing in the toolbox. Click on the toolbox icon, and then click on the “Significance testing” icon.