What’s on this page:
- What is MaxDiffAnalysis?
- When to Use MaxDiff Analysis
- MaxDiff Basic
- MaxDiff Experiment
- Setting Up a MaxDiff in SightX
- MaxDiff Basic
- MaxDiff Experiment
- Sample Size
- Analyzing MaxDiff in SightX
What is MaxDiff Analysis?
MaxDiff (also called Best-Worst Scaling) is an established market research method and academic mathematical theory about how people make choices. It assumes that given a set of items, respondents evaluate all possible pairs of those items and choose the pair that reflects the maximum difference in preference or importance. For example, consider a set in which a respondent evaluates four snack items: cookies, potato chips, tortilla chips, and popcorn.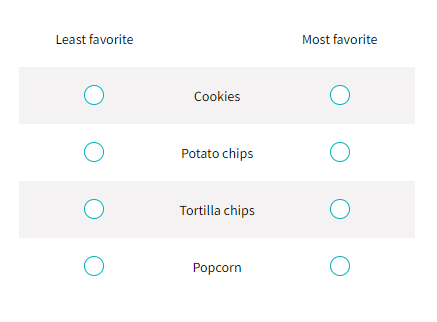
- Cookies > potato chips
- Cookies > popcorn
- Cookies > tortilla chips
- Potato chips > tortilla chips
- Popcorn > tortilla chips
When to Use MaxDiff Analysis
MaxDiff is useful whenever you want to measure the relative importance of product or service features, attributes, or respondent behaviors. Using the analysis output, you can evaluate which attributes are most and least important to inform trade-offs and areas of focus when developing a product or service. There are two types of MaxDiff in SightX: basic and experiment. MaxDiff basic presents the respondent with one set of attributes, while the experiment presents the respondent with multiple sets of attributes, each with different combinations.MaxDiff Basic
Below is an example of a MaxDiff basic question in a survey. The basic question is best for smaller attribute sets so that you do not overwhelm the respondent with too many options, because when there is a longer list, respondents cannot reliably pick which is their favorite/best and which is the opposite. If you have eight or more attributes, you should use a MaxDiff experiment.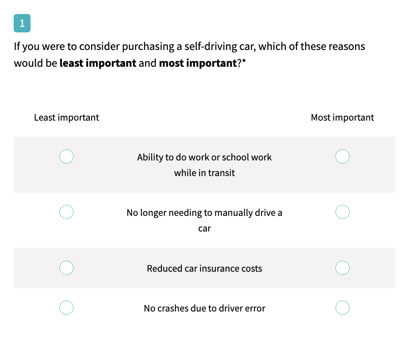
MaxDiff Experiment
Below is a video example of a MaxDiff experiment in a survey. As you can see, eight attributes are presented in combinations of four to the respondent, and the respondent selects the least important and most important out of each set. Embedded contentSetting Up a MaxDiff in SightX
From the Create page, click ”+ Add Item” and select either Max Diff basic from the Questions category, or Max Diff Experiment from the Methodologies category.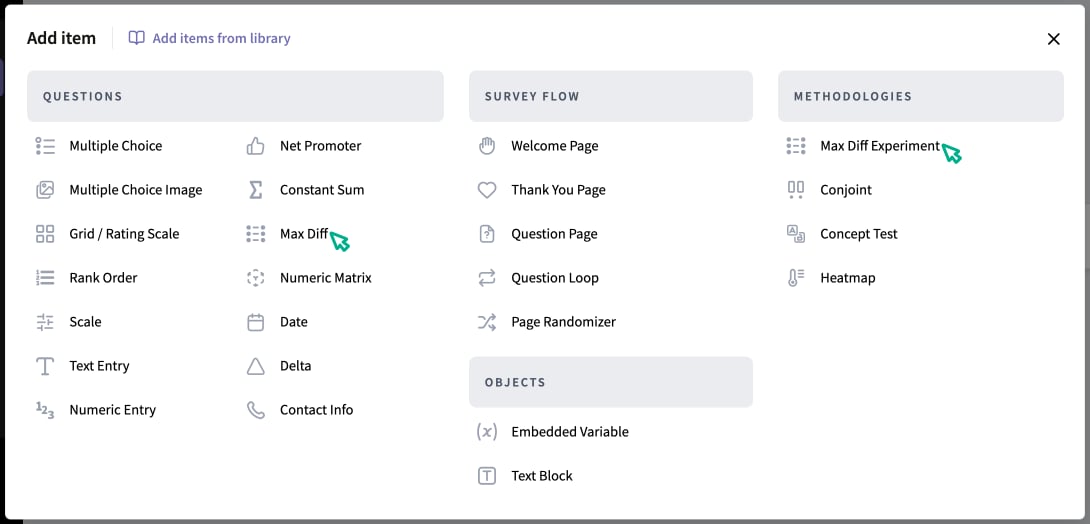
MaxDiff Basic
To set up a basic MaxDiff question, enter your question text as you would with any other question. In the Column Headers dropdown, select the comparison options you want to use for your question. Then, enter the attributes you want to compare in the rows.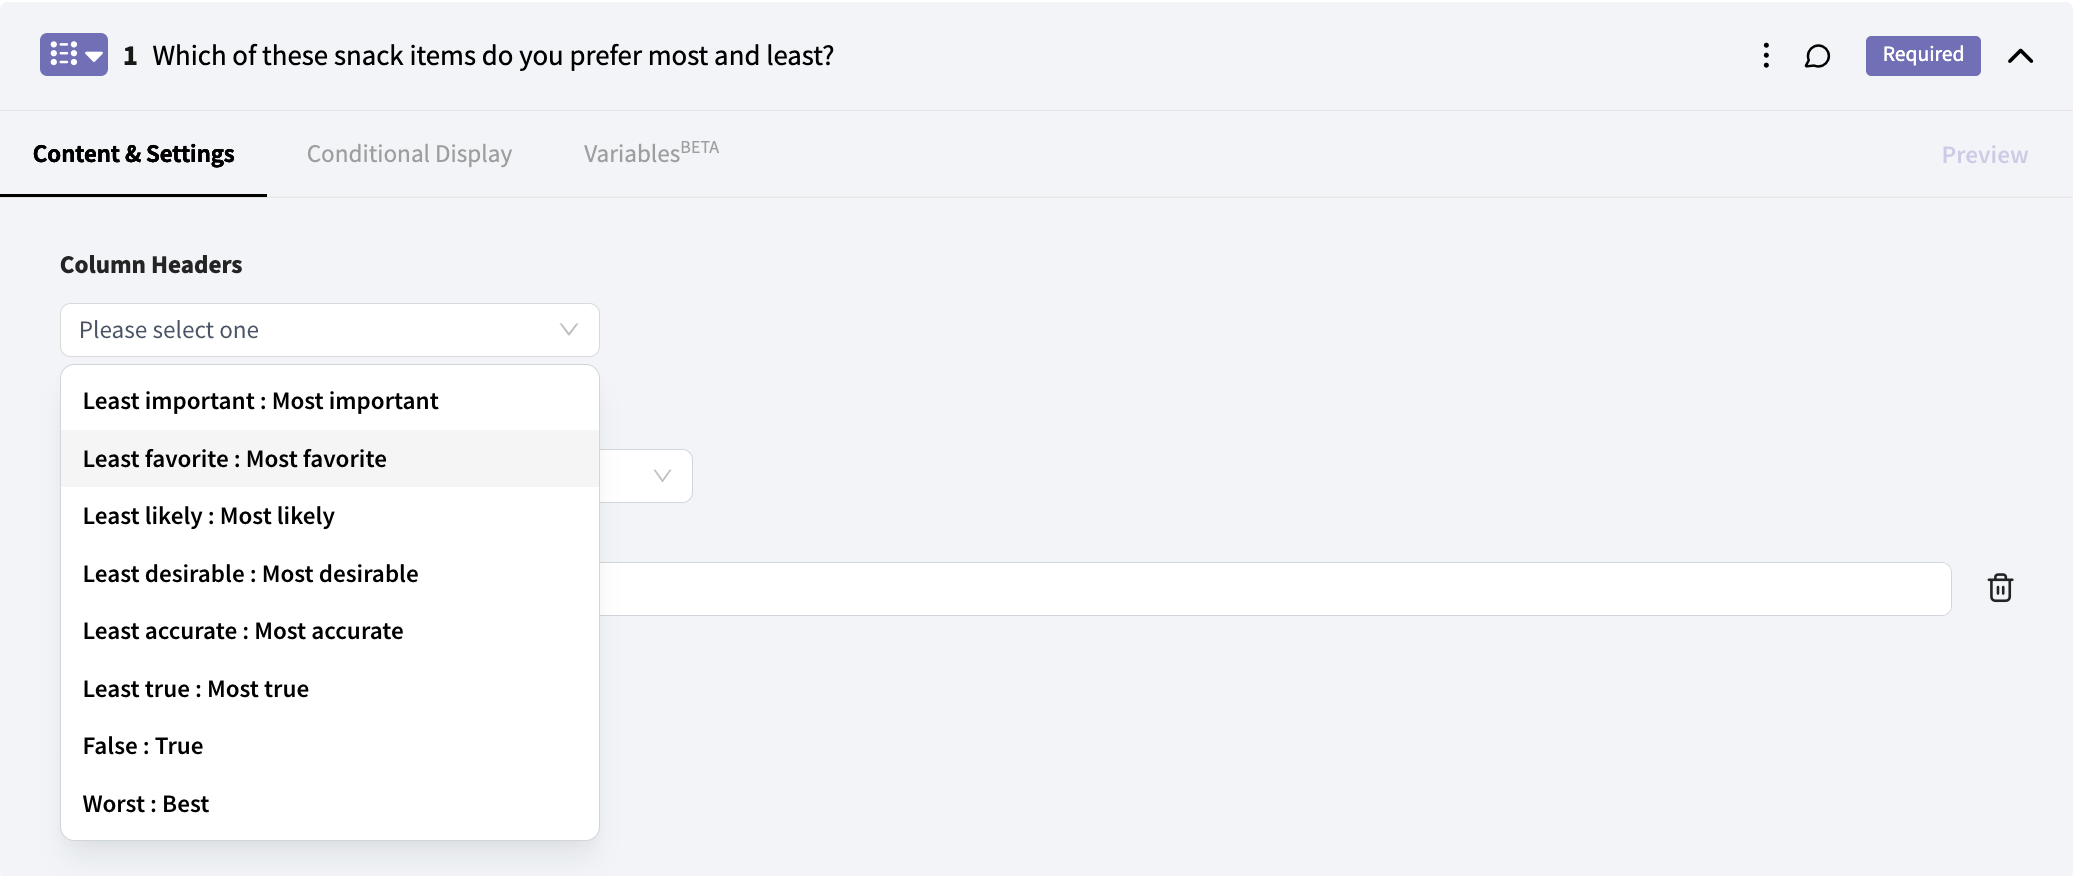
MaxDiff Experiment
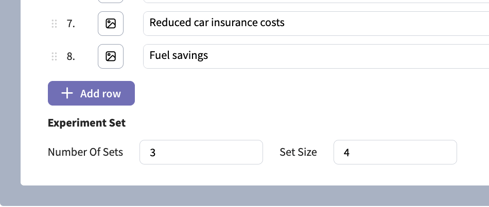
To set up a MaxDiff experiment, enter your question text as you would with any other question. In the Column Headers dropdown, select the comparison options you want to use for your question. Then, enter the attributes you want to compare in the rows. The next inputs are the Number of Sets and Set Size.- Number of sets = the number of combinations that each respondent will be shown
- Set size = how many attributes will be shown in each set
Helpful Tip: We recommend limiting the number of sets to 10 and to limit the set size to six or fewer attributes to prevent respondent fatigue. Sample Size When fielding a survey with a MaxDiff experiment, it’s important to sample enough respondents to ensure enough data for the analysis to be accurate. You can use the formula below to calculate an appropriate sample size, or use our MaxDiff Sample Size Calculator. Minimum Sample Size = 500 * (number of attributes / (number of sets * set size)) Recommended Sample Size = 1000 * (number of attributes / (number of sets * set size))
Analyzing MaxDiff in SightX
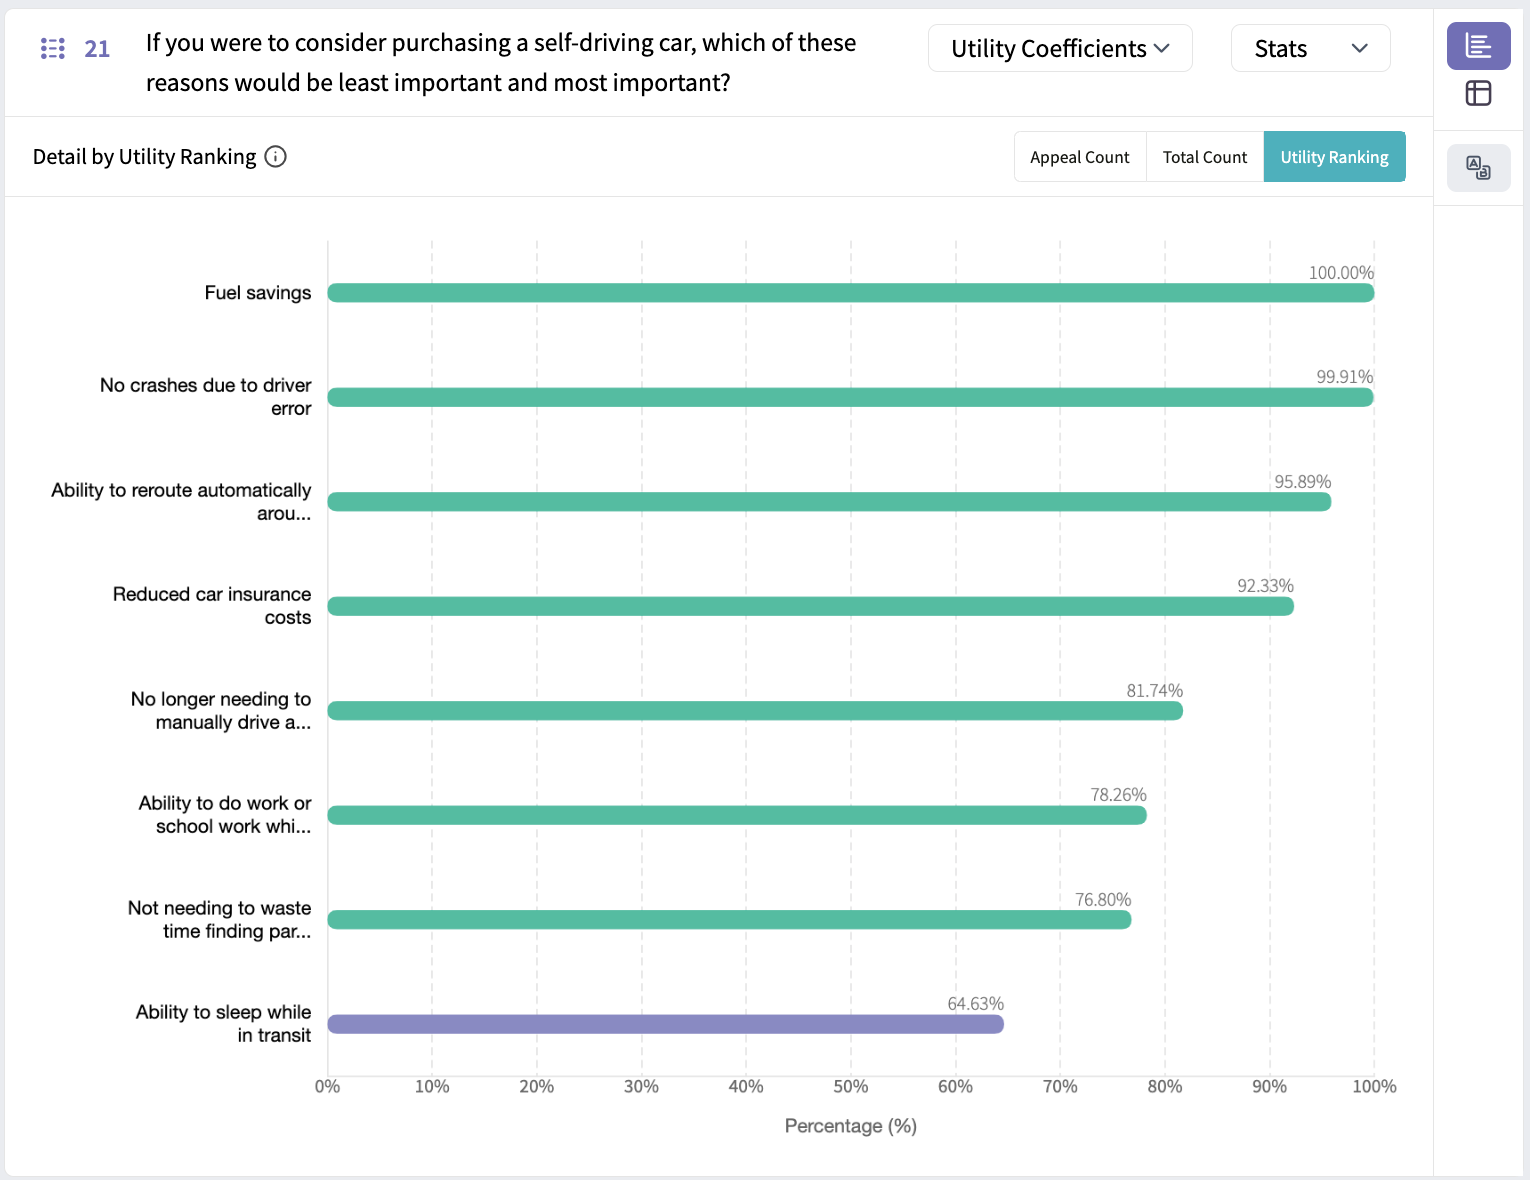
The analysis output of a MaxDiff experiment can be shown by Appeal Count , Total Count , or Utility Ranking. Appeal Count When the chart is configured to show the Appeal Count , it considers all of the sets in which a statement was selected as the most important or least important, and then shows the percentage of times it was selected as the most important, the percentage of times it was selected as the least important, and the net score. The appeal count does not consider the times when a statement was shown in a set, but the respondent did not pick it as either the most or least. The graph above tells us that:
- Out of the times that “No crashes due to driver error” was selected as the most or least, it was selected as the most important reason 82% of the time, and the least important reason 18% of the time. This means that “No crashes due to driver error” is typically a driving reason for respondents to consider purchasing a self-driving vehicle.
- Out of the times that “Ability to sleep while in transit” was selected as the most or least, it was selected as the most important reason 19% of the time, and the least important reason 81% of the time. This means that “Ability to sleep while in transit” is typically not a reason that is important when respondents are considering purchasing a self-driving car.
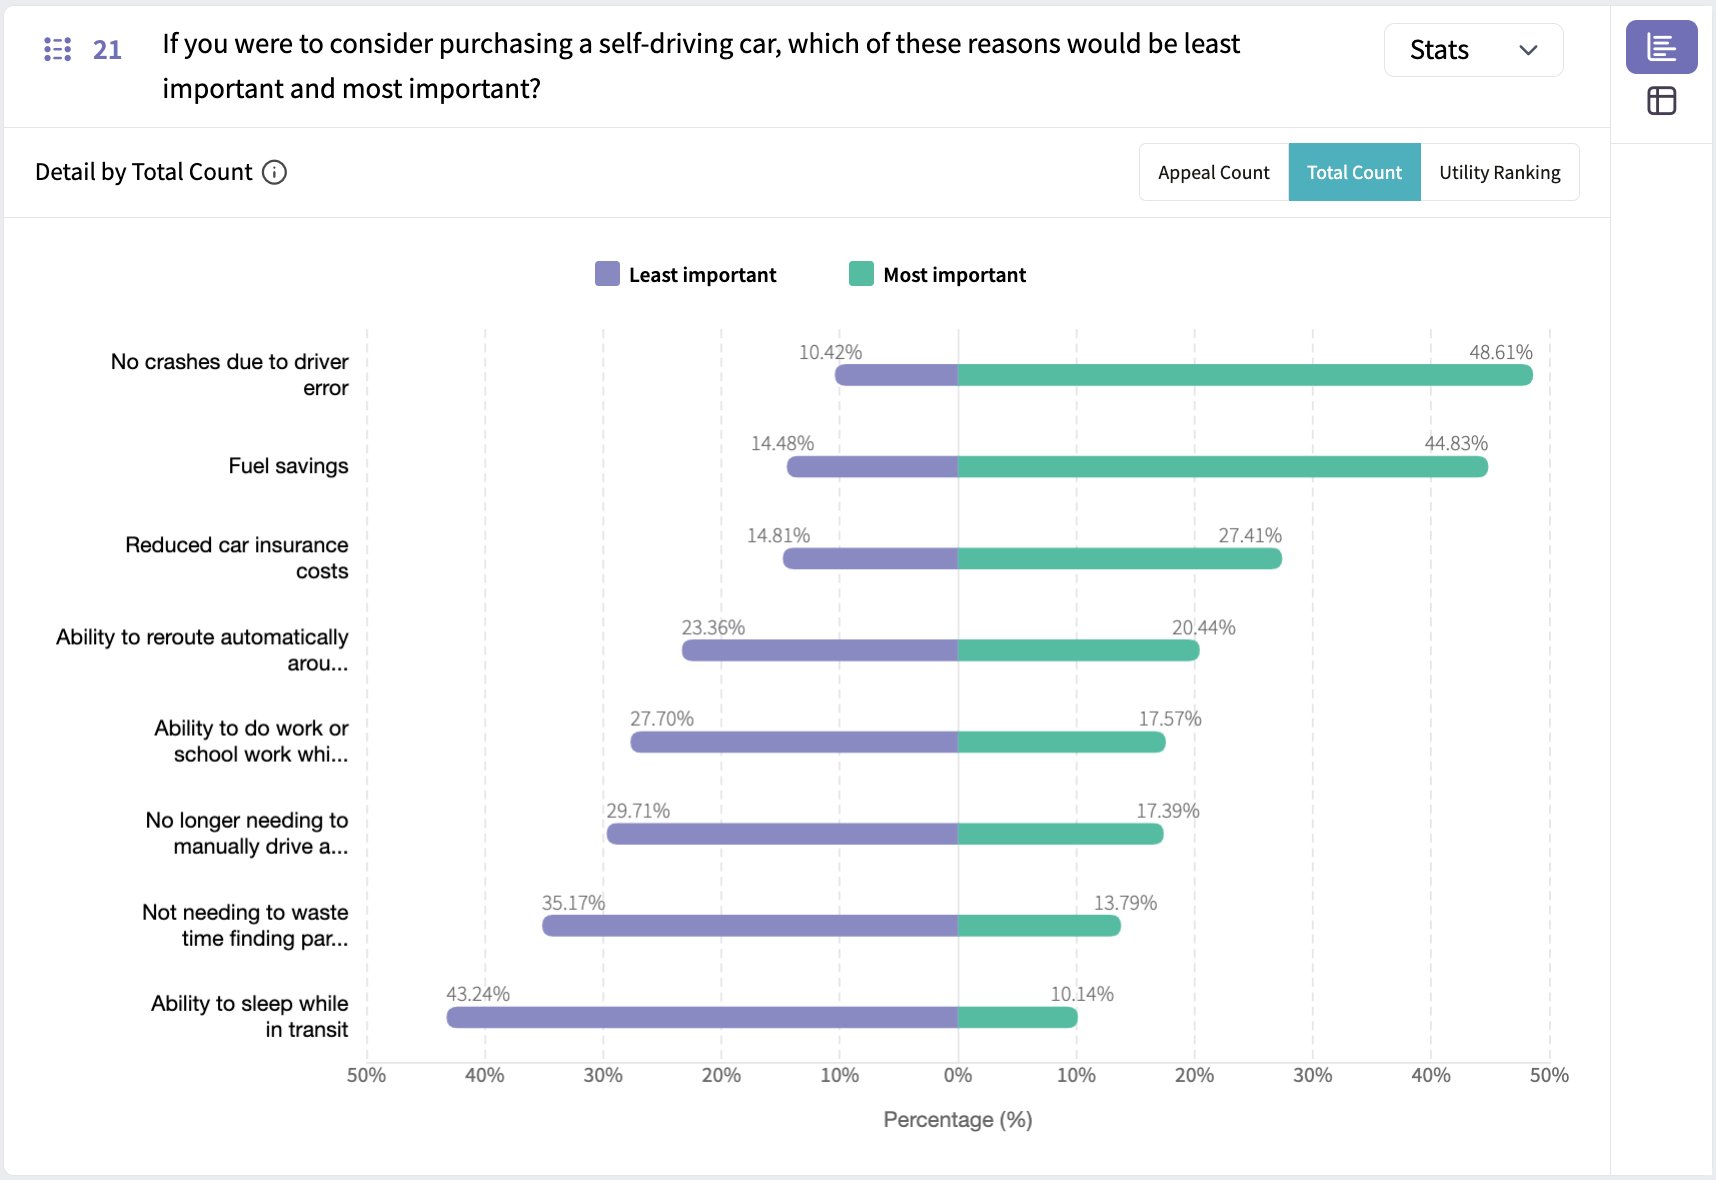
- Out of the times that respondents saw the statement “No crashes due to driver error”, they selected it as the most important reason 49% of the time, and the least important reason only 10% of the time. This is significant, because it means that roughly half the time this option was presented, it was the most important to respondents.
- Out of the times that respondents saw the statement “Ability to sleep while in transit”, they selected it as the most important reason only 10% of the time, and the least important reason 43% of the time. This is significant, because it means that roughly half the time this option was presented, it was the least important reason to respondents.